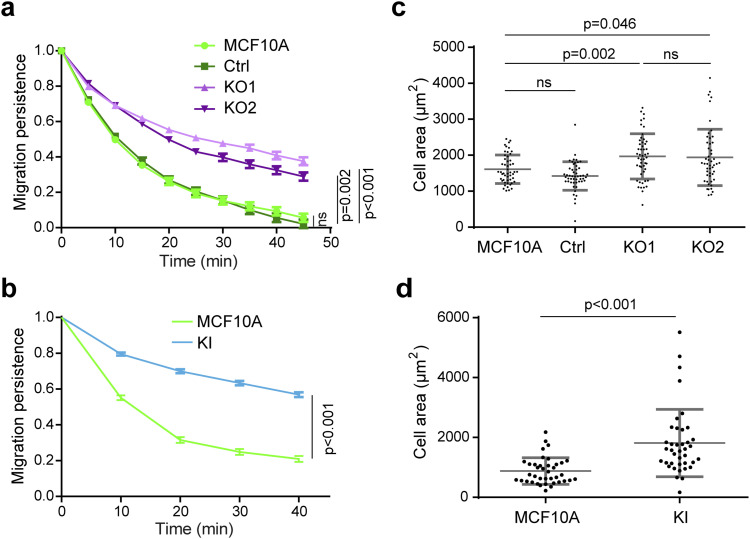
Figure S5. (Extended data of Fig 3) One representative experiment of migration persistence and cell area assays showing the same tendency as the three pooled experiments.
(A, B) Migration persistence of KO (A) and KI cells (B). (B, D) Mean ± SD, n = 34 in (B) and n = 15 in (D), linear mixed-effect model; 1 representative experiment shown. (C, D) Cell area of KO and KI lines. (C, D) Mean ± SD, n = 50 in (C) and n = 39 in (D), t test; 1 representative experiment shown.

