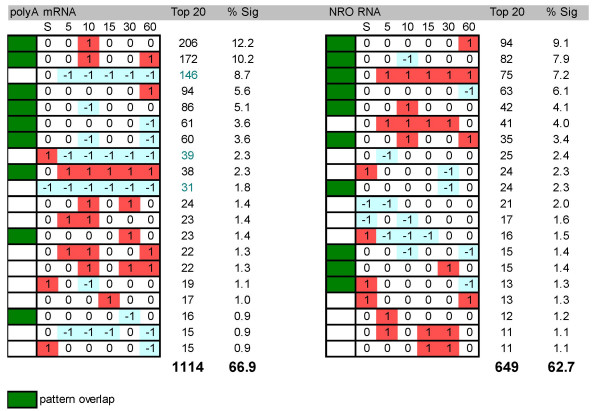
Figure 5.
Frequency distribution of gene expression patterns generated from polyA mRNA or NRO RNA. The top 20 patterns for each method is shown. Significant changes in gene expression were assigned a 1, -1, or 0 for up, down, or no change, respectively. In addition, a value of -1, 0, or 1 (low, moderate, or high) was assigned to each gene according to its relative intensity at baseline (0 time). The absolute numbers of genes in each pattern are reported in the column labeled Top 20 and the percentage of those genes relative to all significantly regulated genes can be found in the column labeled % Sig. Totals are as indicated at the bottom of each column. Filled-in boxes denote patterns equally shared in the top 20 between both methods

