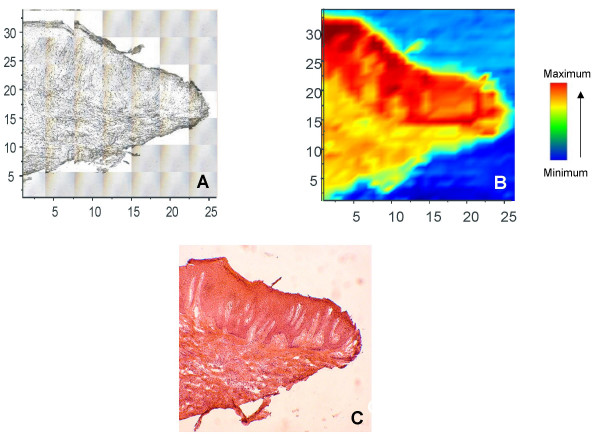
Figure 5.

Comparison of unstained periodontal tissue section with H and E staining and the associated IR mapping. The original periodontal tissue used for IR mapping (A), as defined by the adjacent tissue stained with H&E (B), correlates very well with the IR chemical map based on protein band intensity (C). The color bar indicates the relative intensity of the specific IR band in the tissue.
