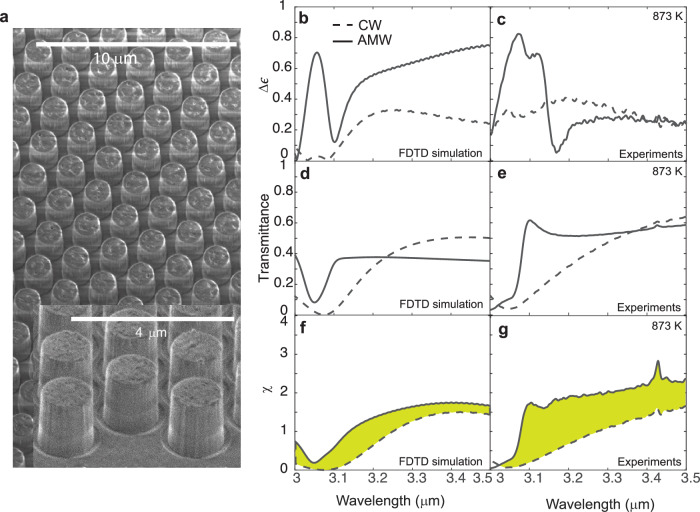
Fig. 3. Emission asymmetry, transmittance, and χ of control window (CW) and asymmetric meta-window (AMW) at 873 K.
a Scanning electron micrograph of the fabricated AMW, with 350 nm thick spacers, on a fused silica window. b, c show the calculated and measured Δϵ spectra, respectively. The dashed and solid lines plot these quantities for the CW and AMW, respectively. Likewise, (d) and (e) show the calculated and measured transmission spectra, and (f) and (g) show the calculated and measured χ, all with ϵ− facing the camera. The spectral range with enhanced χ for AMW is shaded in green.

