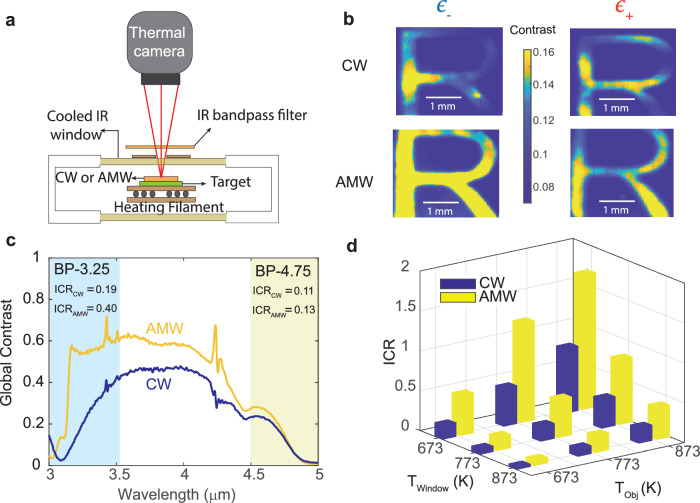
Fig. 4. Contrast in thermal imaging through the hot emissive control window (CW) and asymmetric meta-window (AMW).
a Schematic of the thermal imaging set-up employed to capture thermal images of the object through sample windows. b Weber contrast map of thermal images of the object (carbon film on tungsten patterned in the shape of the letter R), captured using a mid-IR camera (FLIR A6701) through the CW and AMW with the low or high emissivity surface (ϵ− or ϵ+) facing the camera. The object, chamber, and windows are held at 873 K. The images were acquired with a BP-3.25 (3.0–3.5 μm) bandpass filter in front of the camera. c The global contrast ratio (CR) corresponding to the CW and AMW is calculated using Eq. (2) for each wavelength. The calculations use measured emissivity spectra of the carbon film, tungsten, CW (ϵ−), and AMW (ϵ−) at 873 K. The shaded regions correspond to the bandwidths of filters BP-3.25 and BP-4.75, and the inset tables show the integrated contrast (ICR) values in the respective spectral bands. d ICR is calculated using measured emissivity and transmission spectra of the CW and AMW when the object and window are at different temperatures (TObj and TWindow, respectively).

