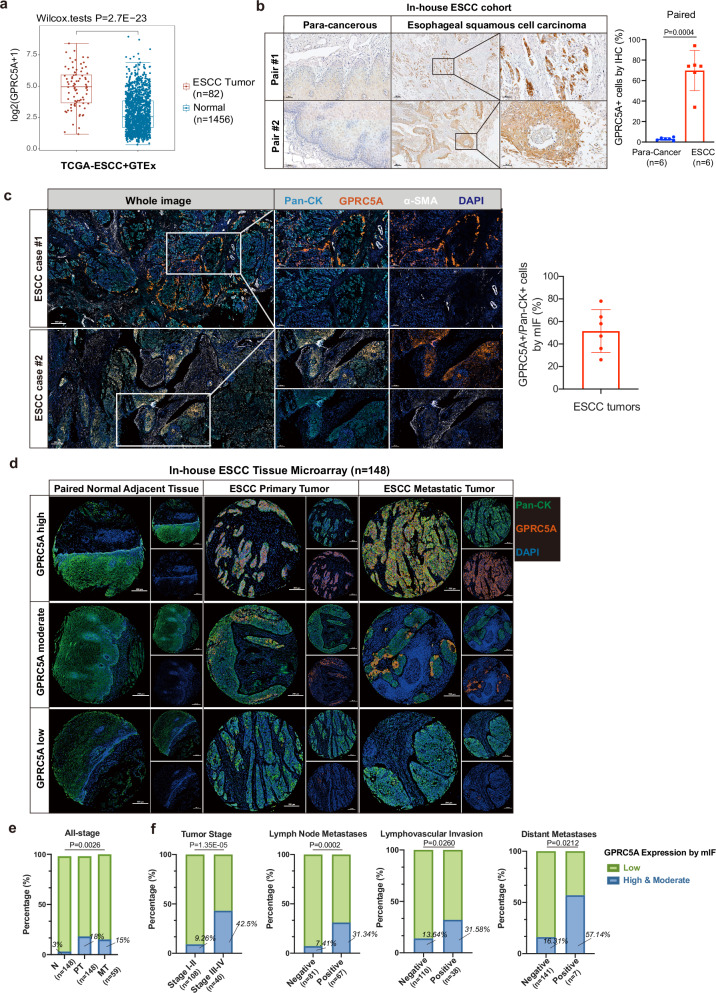
Fig. 2. Upregulation of GPRC5A in ESCC tumors and its association with aggressive tumor behaviors.
a Analysis of GPRC5A expression levels in ESCC tumors (n = 82) obtained from the TCGA-ESCC database compared to normal esophageal tissues (n = 1456) from the GTEx database, evaluated using a two-sided Wilcoxon signed-rank test. b Representative images of IHC GPRC5A staining demonstrating GPRC5A expression and the proportion of GPRC5A-positive cells in ESCC tumors versus paired adjacent tissues (n = 6), analyzed using a two-sided paired t-test. c Representative images of multi-channel immunofluorescence (mIF) staining showcasing Pan-Cytokeratin (Pan-CK, a tumor cell marker, shown in light blue), GPRC5A (shown in orange), alpha-smooth muscle actin (α-SMA, a stromal cell marker, shown in white), and DAPI (shown in dark blue) in primary tumors from ESCC patients (n = 6) in our in-house cohort. The bar plot illustrates the percentage of GPRC5A-positive/Pan-CK-positive cells by mIF staining in ESCC tumors. d Overview of GPRC5A expression stratified into high/moderate, and low categories within an ESCC tissue microarray (TMA) comprising paired normal adjacent esophageal epithelium (n = 148), ESCC primary tumors (n = 148), and lymph node metastatic tumors (n = 59), analyzed via mIF staining using Pan-CK (green), GPRC5A (orange), and DAPI (blue). e Proportion of high or moderate (green) and low (blue) GPRC5A expression levels across the ESCC TMA, including normal tissues (n = 148), primary tumors (n = 148), and metastatic tumors (n = 59). Two-sided Chi-Squared test is used for statistical analysis. f Correlation analysis of GPRC5A expression (high/moderate in green vs. low in blue) with clinical parameters, including tumor stage (I-II, n = 108 vs. III-IV, n = 40), lymph node metastasis (negative, n = 81 vs. positive, n = 67), lymphovascular invasion (negative, n = 110 vs. positive, n = 38), and distant metastasis (negative, n = 141 vs. positive, n = 7), determined using two-sided Chi-squared or Fisher’s exact tests. The data are presented as the mean ± SD (bar plots) and median ± IQR (whiskers = 1.5 × IQR, box & whiskers plots). The n number represents n biologically independent samples/patients in each group. Source data are provided as a Source Data file.

