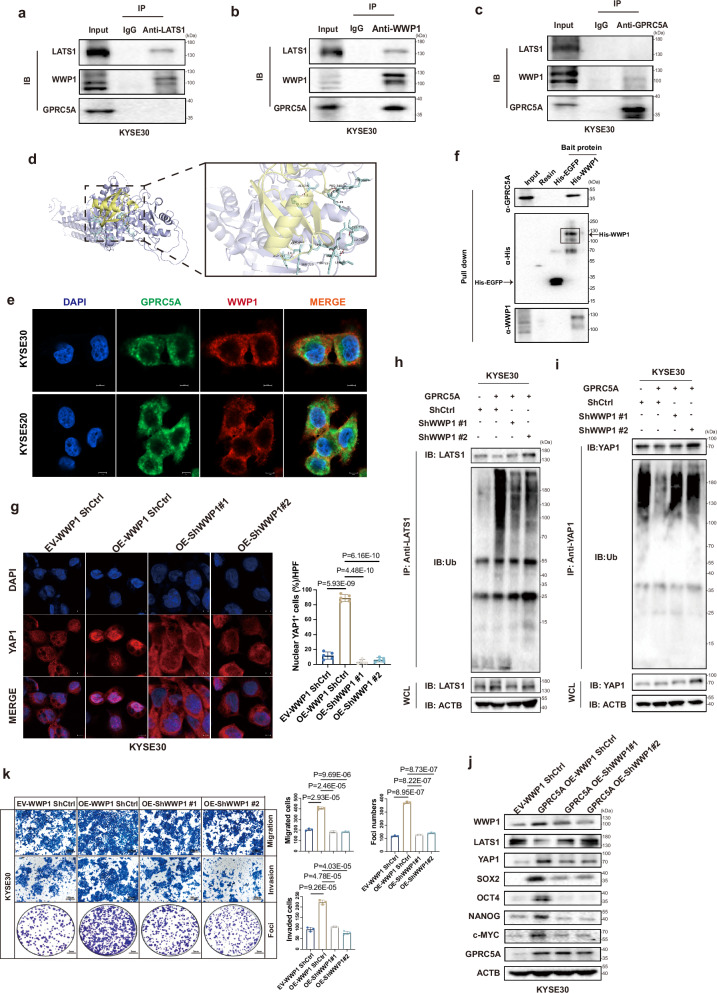
Fig. 5. Interaction of GPRC5A and WWP1 induces LATS1 degradation and activates YAP1.
a–c Co-immunoprecipitation (co-Ip) assays to illustrate the interaction between GPRC5A, WWP1, and LATS1, utilizing anti-LATS1 (a), anti-WWP1 (b), and anti-GPRC5A antibodies (c) in whole cell lysates from KYSE30 parental cells (n = 3). The samples derive from the same experiment but different gels for anti-GPRC5A, another for anti-WWP1, another for anti-LATS1 were processed in parallel. d The predicted 3D structure of the GPRC5A (yellow) and WWP1 (purple) complex, along with the potential binding sites indicated by light blue chemical bonds, is generated through molecular docking analysis and visualized using PyMOL software. e Immunofluorescence co-localization staining of GPRC5A (green), WWP1 (red), and DAPI (blue) is conducted in KYSE30 and KYSE520 parental cells to further confirm their potential interaction (n = 3). f Protein pull-down assays were executed using recombinant His-tagged WWP1 and EGFP proteins in KYSE520 cell lysates (n = 3). The samples derive from the same experiment but different gels for anti-GPRC5A, another for anti-His, another for anti-WWP1 were processed in parallel. g Representative ICC staining images of YAP1 (red) and DAPI (blue) in WWP1-silenced KYSE30 cells overexpressing GPRC5A, treated with MG132 (10 µM), is presented along with a bar plot illustrating the percentage of nuclear YAP1-positive cells per HPF (n = 5, two-sided unpaired t-test). h–i Immunoblotting was performed to assess the ubiquitination levels of YAP1 and LATS1, which were precipitated using respective antibodies in WWP1-knockdown KYSE30 cells overexpressing GPRC5A, following pretreatment with MG132 (10 µM) (n = 3). WCL, whole cell lysates. The samples derive from the same experiment but different gels for anti-LATS1, another for anti-ubiquitin, another for anti-ACTB were processed in parallel. j, k Transwell assays for migration, invasion, and foci formation (n = 3, two-sided unpaired t-test) are conducted, alongside an evaluation of YAP1 downstream gene expression (n = 3) in WWP1-silenced KYSE30 cells with GPRC5A overexpression. The samples derive from the same experiment but different gels for all tested antibodies were processed in parallel. Data are presented as mean ± SD (bar plots), and the n number represents n biologically independent samples/experiments in each group. Source data are provided as a Source Data file.

