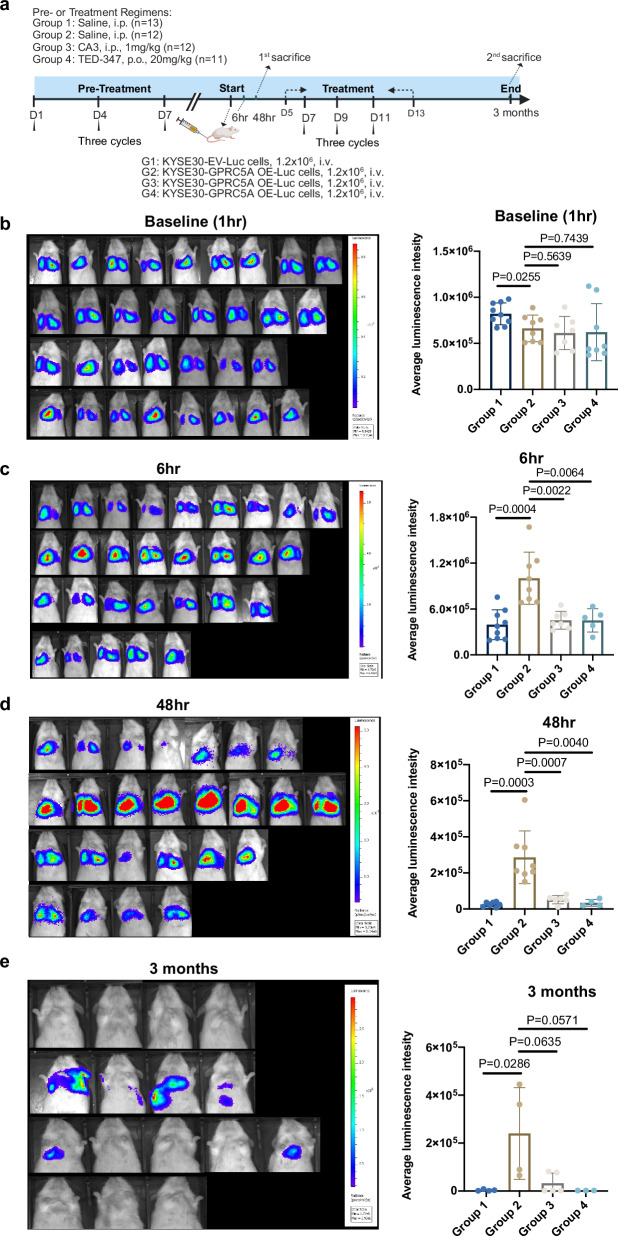
Fig. 6. Inhibition of YAP1 impedes early implantation and metastatic tumor outgrowth in ESCC.
a Experimental design illustrating the use of YAP1-TEAD inhibitors (CA3 and TED-347) in a murine model to evaluate their effects on both lung micro-metastases and macro-metastases associated with ESCC. This figure is created in BioRender. Bella, liub1128@outlook.com. (2024) BioRender.com/g35e219. b–d Bioluminescence imaging is employed to assess and quantify the average luminescence intensity in the lungs of mice at baseline (b, 1 hour post-injection; Group 1 n = 9, Group 2 n = 8, Group 3 n = 7, Group 4 n = 8), at 6 hours (c, Group 1 n = 9, Group 2 n = 8, Group 3 n = 7, Group 4 n = 5), and at 48 hours (d, Group 1 n = 7, Group 2 n = 8, Group 3 n = 6, Group 4 n = 4) following pre-treatment with or without YAP1-TEAD inhibitors over three cycles. Statistical analysis is performed using a two-sided unpaired t-test for baseline and 6 hours and a two-sided Wilcoxon signed-rank test for 48 hours. e Long-term outcomes are evaluated at 3 months post-injection, with BLI and quantification of average luminescence intensity in the lungs of mice treated with or without YAP1-TEAD inhibitors over six cycles (Group 1 n = 4, Group 2 n = 4, Group 3 n = 5, Group 4 n = 3). Statistical analysis was performed using a two-sided Wilcoxon signed-rank test. Average luminescence intensity is calculated as photons/second/cm²/steradian. Data are presented as mean ± SD (bar plots), and the n number represents n biologically independent samples in each group. Source data are provided as a Source Data file.

