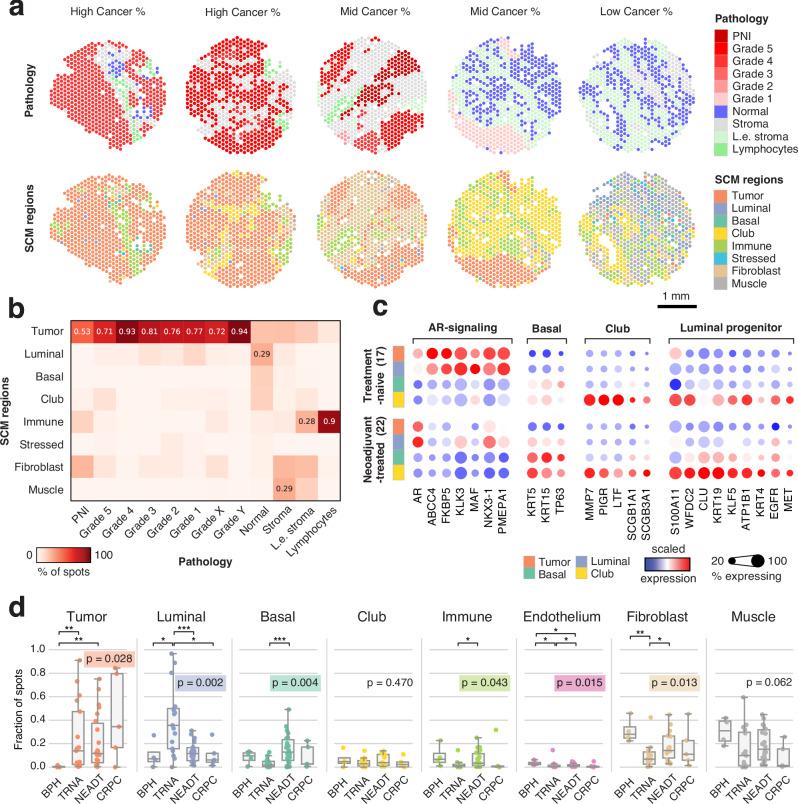
Fig. 2. SCM regions match histopathological features and reflect treatment-dependent shifts in gene expression.
a Histopathology classes and SCM regions of five representative samples from the validation cohort. Grade X and Grade Y are cancer spots with indecisive grading (see Methods). PNI: perineural invasion; L.e. stroma: lymphocyte-enriched stroma. Scale bar is 1 mm. b Percentage of SCM regions in each histopathology category in the validation cohort. Values are shown for each region with the highest percentage. c Scaled gene expression in SCM regions grouped by ADT exposure. d Sample-specific SCM region fractions divided according to sample category: BPH: Benign prostatic hyperplasia (n = 4); TRNA: Treatment-naïve prostate cancer (n = 17); NEADT: Neoadjuvant-treated prostate cancer (n = 22); CRPC: Castration-resistant prostate cancer (n = 5). A Kruskal-Wallis test p-value is displayed for each category, while asterisks indicate two-sided Wilcoxon rank-sum test significance level; *p < 0.05; **p < 0.01; ***p < 0.001. Boxes span the interquartile range (IQR) and whiskers extend to points that lie within 1.5 IQRs of the lower and upper quartile. Center line is drawn at the median.

