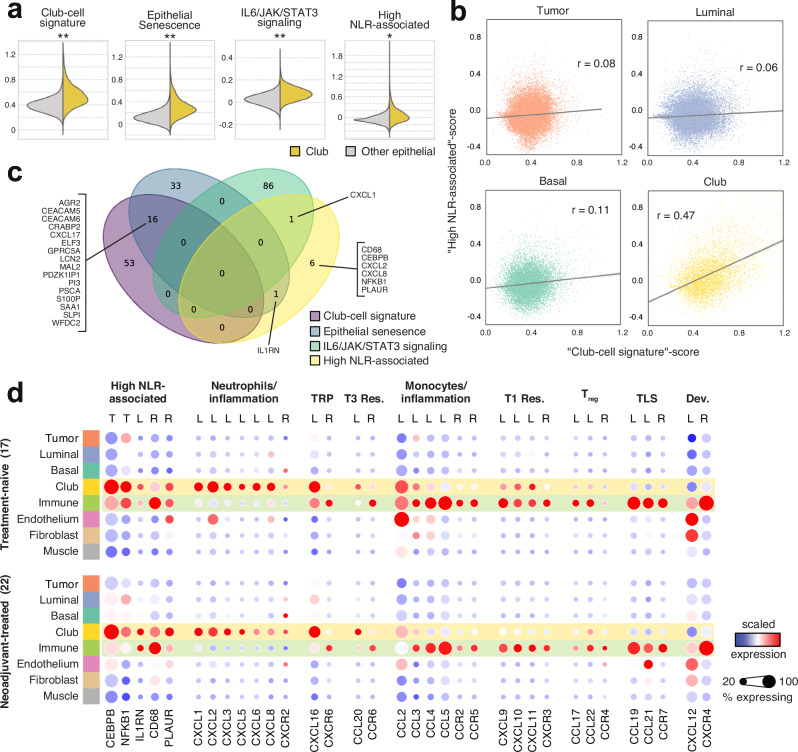
Fig. 3. The Club region has increased expression of genes linked to a senescence-associated secretory phenotype.
a Spotwise gene set activity scores in the Club region (n = 5595) compared to other epithelial regions (n = 59,198). Asterisks indicate two-sided independent samples t-test p-value (p < 0.05) and effect size: *Other 70th percentile <Club region mean; **Other 80th percentile <Club region mean; ***Other 90th percentile <Club region mean b Gene set score correlation for club-cell signature and high neutrophil-to-lymphocyte ratio-associated (NLR) signature in epithelial regions. c A Venn diagram of gene sets shown in (a). d Scaled gene expression in SCM regions divided by sample category. Genes are grouped according to immunological function. TRP: tissue-resident program, T3 Res: Type 3 immune response, T1 Res: Type 1 immune response, Treg: regulatory T cells, TLS: Tertiary lymphoid structure, Dev.: Developmental program, T: transcription factor, L: chemokine ligand, R: chemokine receptor.

