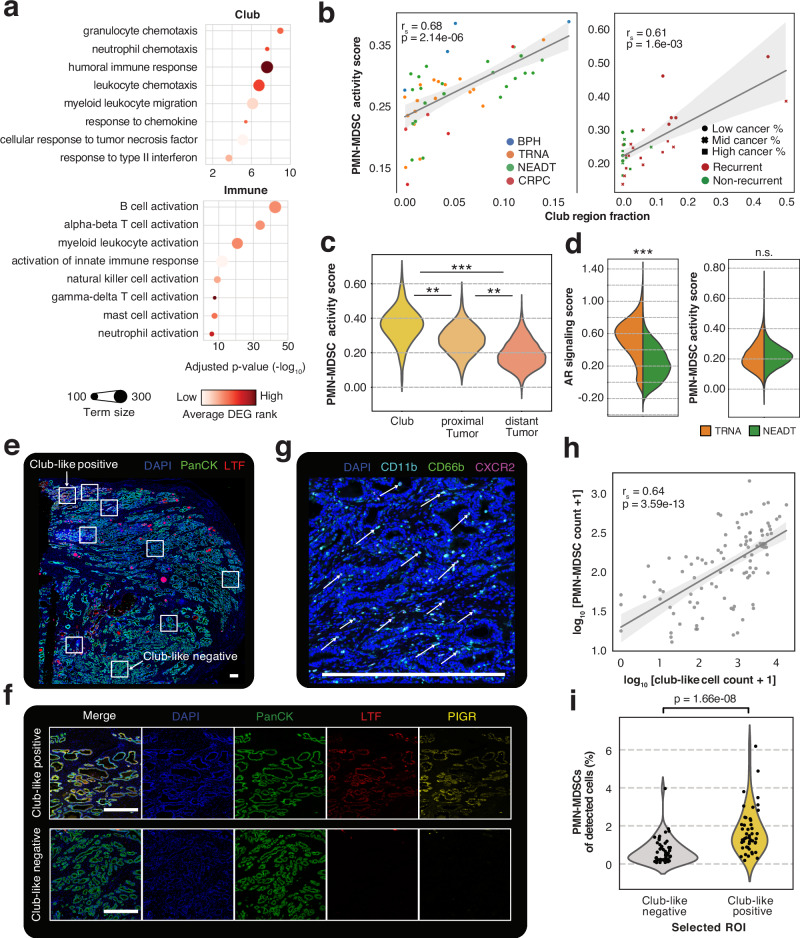
Fig. 4. Club-like cell enriched regions are associated with increased myeloid-derived suppressor cell infiltration.
a GO:BP term enrichments for genes with upregulated expression in the Club (top) and Immune (bottom) regions. One-sided Fisher’s exact test was used. b Correlation between Club region fraction and PMN-MDSC activity scores in pseudo-bulk for the discovery (left) and the validation (right) cohorts. Two-sided Spearman correlation coefficient and p-value are shown. Error bands in light grey span the 95% confidence interval calculated using a bootstrap. BPH: benign prostatic hyperplasia (n = 4), TRNA: treatment-naïve prostate cancer (n = 17); NEADT: neoadjuvant-treated prostate cancer (n = 22); CRPC: Castration-resistant prostate cancer (n = 5). Low cancer% n = 11, Mid cancer % n = 11, High cancer % n = 10. c PMN-MDSC activity score in treatment-naïve spots grouped according to their proximity to the Club region. Asterisks indicate two-sided independent samples t-test significance levels (p < 0.05) and effect size: *70th percentile <mean; **80th percentile <mean; ***90th percentile <mean. Club region (n = 278), proximal Tumor (n = 687), distant Tumor (n = 8751). d Violin plots of gene set activity scores across all regions in treatment-naïve (n = 36,198) and neoadjuvant-treated (n = 59,259) samples. Asterisks are the same as in (c). e A representative immunostained prostate tissue section (total n = 16) with selected regions of interest (ROIs). f Representative images of club-like positive (n = 47) and club-like negative (n = 54) ROIs corresponding to those annotated in (e). g A representative image of a club-like positive ROI (n = 47) with a three-colour stain showing CD66b+CD11b+CXCR2+ PMN-MDSCs. Arrows point to example cases. Scale bars in white are 500 μm in each panel. h Scatterplot of log-transformed club-like cell and PMN-MDSC cell counts. Each dot represents a ROI (n = 101). Correlation coefficient, p-value, and error bands were calculated the same as in (b). i Violinplot of PMN-MDSC percentage of all detected cells in club-like negative (n = 54) and club-like positive (n = 47) ROIs. A Wilcoxon rank-sum test p-value is shown.

