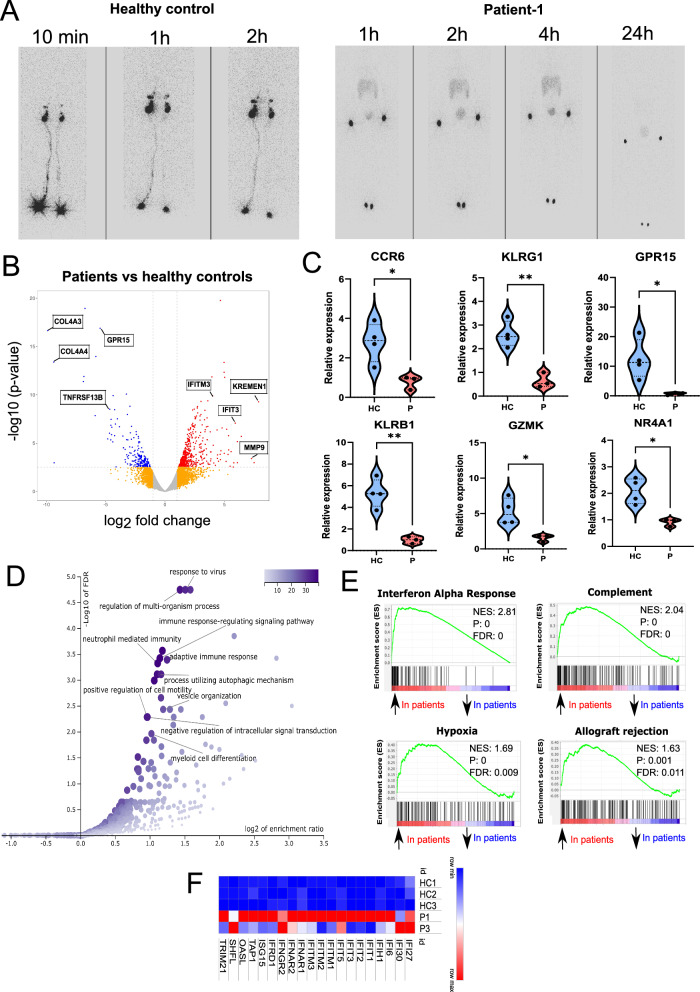
Fig. 3. Defective SLO and peripheral B cell development in IKKαG167R patients.
A Lymphoscintigraphy analysis in a healthy paediatric control and P1 showing the absence of lymphatic flow and therefore lymph nodes in the patient. Images were taken 10 min, 1-, 2-, 4- and 24 h post injection of radiotracer. B Volcano plot analysis of differentially expressed genes (DEGs) in healthy controls (n = 3) vs IKKαG167R patients (P1 and P3). Differential gene expression analysis was conducted using the likelihood ratio test within the edgeR package90, which is based on a negative binomial distribution model. P-values were adjusted for multiple testing using the Benjamini-Hochberg procedure. Genes with FDR-adjusted p-values less than 0.05 were considered statistically significant. C qRT-PCR analysis of C-C motif chemokine receptor 6 (CCR6) (p = 0.0212), killer cell lectin like receptor G1 (KLRG1) (p = 0.0027), G protein-coupled receptor 15 (GPR15) (p = 0.0322), killer cell lectin like receptor B1 (KLRB1) (p = 0.0028), granzyme K (GZMK) (p = 0.0215), and nuclear receptor subfamily 4 group A member 1 (NR4A1) (p = 0.0105) transcripts. GAPDH levels were used as a normalisation control (n = 4 healthy controls and n = 3 patients, two-tailed, non-paired t-test was used for statistical analysis). D Over representation analysis (ORA) of DEGs, as performed by WebGestalt, showing biological processes significantly associated with DEGs. E Selected hits of Gene Set Enrichment Analysis (GSEA) of DEGs. Weighted Kolmogorov–Smirnov test was used for statistical analysis56. F Heatmap analysis of DEGs involved in interferon response based on normalized CPM values in RNA-seq analysis.

