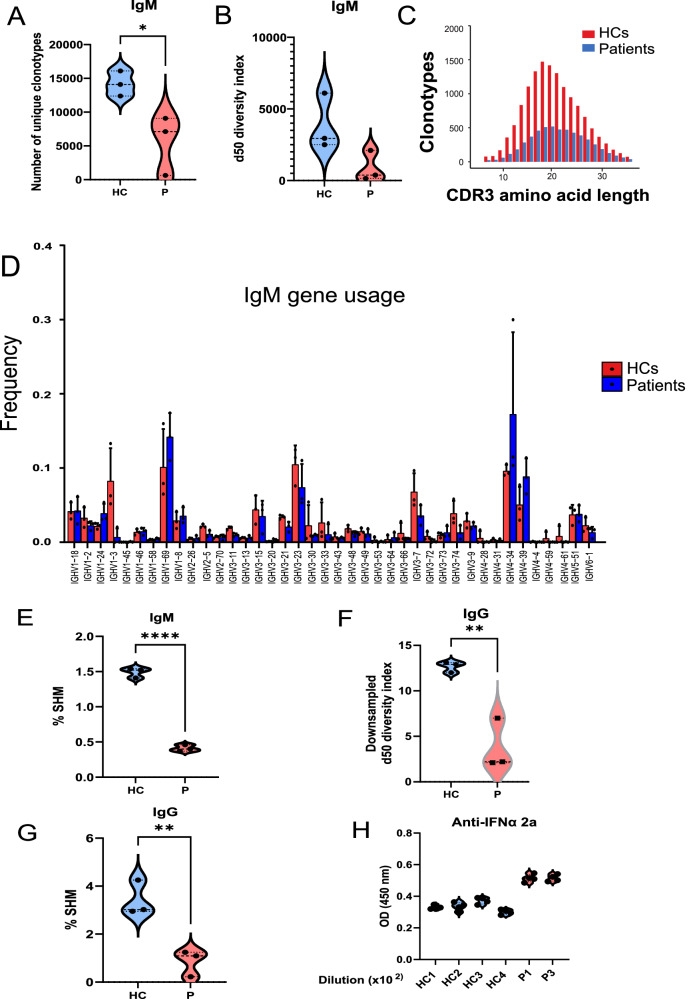
Fig. 5. BCR gene usage analysis in patients and healthy controls.
A–C Number of unique clonotypes, d50 diversity index (number of clonotypes occupying 50% of the repertoires), and complementarity-determining region 3 (CDR3) amino acid length of the BCR IgM (B cell receptor μ heavy chain) repertoire in healthy controls (n = 3) and patients (n = 3). Although the d50 diversity index did not reach statistical significance, possibly due to the sample size, there was a trend of limited BCR IgM diversity (p = 0.08). D BCR IgM (B cell receptor μ heavy chain) gene usage comparison between patients and healthy controls. Red bars indicate healthy controls (n = 3), and blue bars indicate IKKαG167R patients (n = 3). Two-tailed, non-paired t-test was used for statistical analysis. Data are presented as mean values and SD. E Somatic hypermutation (SHM) rate was calculated in rearranged variable regions of the IgM heavy chain (IGHV) genes and given as the percentage of insertions and/or deletions in total number of sequences in patients and healthy controls. Two-tailed, non-paired t-test was used for statistical analysis, p < 0.0001. F Downsampled d50 diversity index (number of clonotypes occupying the 50% of repertoires) and complementary-determining region 3 (CDR3) amino acid length of BCR IgG (B cell receptor γ heavy chain) repertoire of healthy controls and patients. Normalization was performed by downsampling the data to the smallest number of clones. Two-tailed, non-paired t-test was used for statistical analysis, p = 0.0057. G Somatic hypermutation (SHM) rate was calculated in rearranged variable regions of the IgG heavy chain (IGHV) genes and given as the percentage of insertions and/or deletions in total number of sequences in patients and healthy controls. Two-tailed, non-paired t-test was used for statistical analysis, p = 0.0084. H Auto-antibodies against interferon alfa (IFNα) 2a were tested by enzyme-linked immunosorbent assay (ELISA) using plasma samples from 4 healthy controls and 2 patients (P1 and P3). OD measurements at 450 nm were shown from 1/100 diluted plasma samples.

