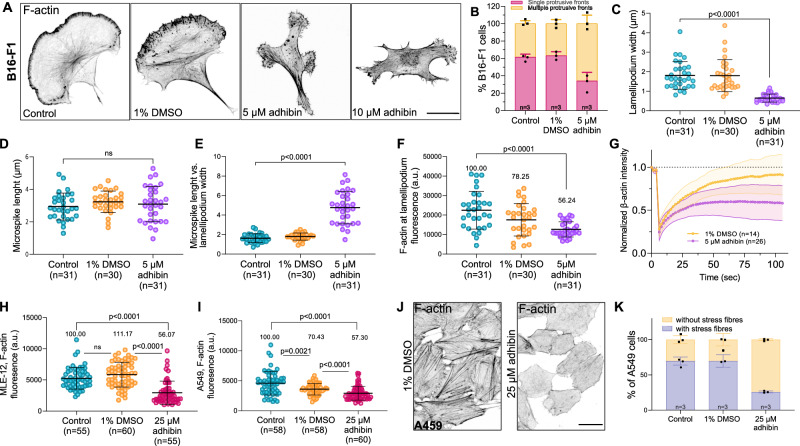
Fig. 3. Adhibin perturbs actin dynamics and stability.
A Representative z-slice of F-actin in B16-F1 cells before and after treatment with 5 μM and 10 μM adhibin (18 h exposure). Scale bars: 20 μm. B Percentage of B16-F1 cells with one or multiple protrusive fronts. C Lamellipodium width (one-way Kruskal–Wallis test), (D) microspike length (one-way ANOVA), (E) microspike length relative to lamellipodium width (one-way Kruskal–Wallis test), (F) F-actin content at the lamellipodium (one-way Kruskal–Wallis test) in adhibin treated and B16-F1 cells. G Normalized fluorescence recovery curves of β-actin intensity at lamellipodia. H Cytoplasmic F-actin content in MLE-12 cells (two-tailed Mann–Whitney test for two-column comparison, or one-way Kruskal–Wallis test for multiple comparisons), and (I) in A549 cells with and without adhibin treatment (two-tailed Mann–Whitney test for two column comparison, or one-way Kruskal–Wallis test for multiple comparisons). J Representative z-projections showing actin in control and 25 μM adhibin treated A549 cells. Scale bars: 20 μm. K Percentage of A549 cells with and without stress fibres. In all bar diagrams n is the number of experiments and in all box plots n is the number of cells analysed. All data are represented as mean ± S.D. a.u. = arbitrary units.

