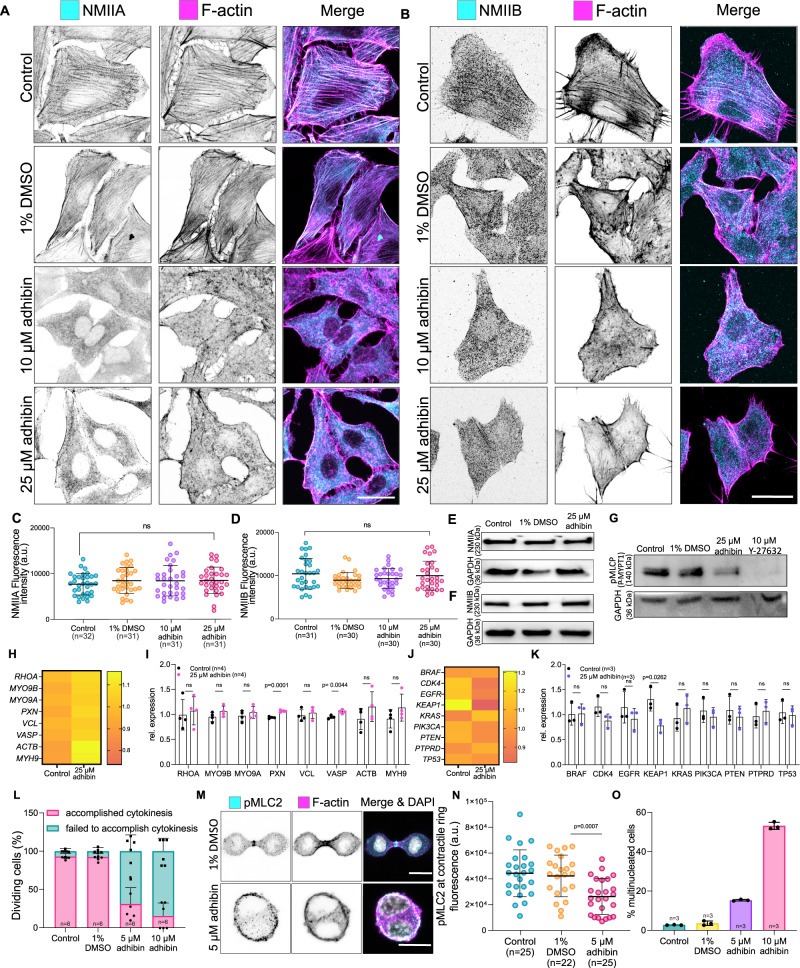
Fig. 7. Adhibin prevents stress fibre formation and interferes with cytokinesis by downregulating RhoA pathways of NM2A/B activation.
A, B Representative confocal images showing NM2A and NM2B localization and loss of stress fibres in phalloidin stained A459 cells upon adhibin treatment. Scale bars: 20 μm. C, D Amount of NM2A and NM2B in control, 1% DMSO, 10 μM adhibin and 25 μM adhibin treated A459 cells (C: one-way ANOVA, D: one-way Kruskal–Wallis test). E, F Western blots of A549 whole cell lysates showing the total amount of NM2A and NM2B in adhibin treated and cells relative to GAPDH. G Western blot of A549 whole cell lysates showing the total amount of p-MYPT1 in adhibin and Y-27632 treated and cells relative to GAPDH. H, K qPCR data showing relative changes in the expression of cytoskeleton-associated genes (H–I: two-tailed unpaired t-test) and metastasis-related genes (J, K: two-tailed unpaired t-test or Mann–Whitney test) upon adhibin treatment as heat map and bar diagram representation. L Percentage of B16-F1 cells entering mitosis during 3 h. M Confocal z-projections of pMLC2 and phalloidin in dividing B16-F1 cells in the presence and absence of adhibin. Scale bars: 10 µm. N Fluorescence intensity of pMLC2 at the contractile ring of dividing B16-F1 cells in the presence and absence of adhibin (two-tailed unpaired t-test). O Percentage of B16-F1 cells with multiple nuclei with and without adhibin addition. In all bar diagrams n is the number of experiments and in all box plots n is the number of cells analysed. All data are represented as mean ± S.D. All experiments were reproduced at least three times with similar results. a.u. = arbitrary units.

