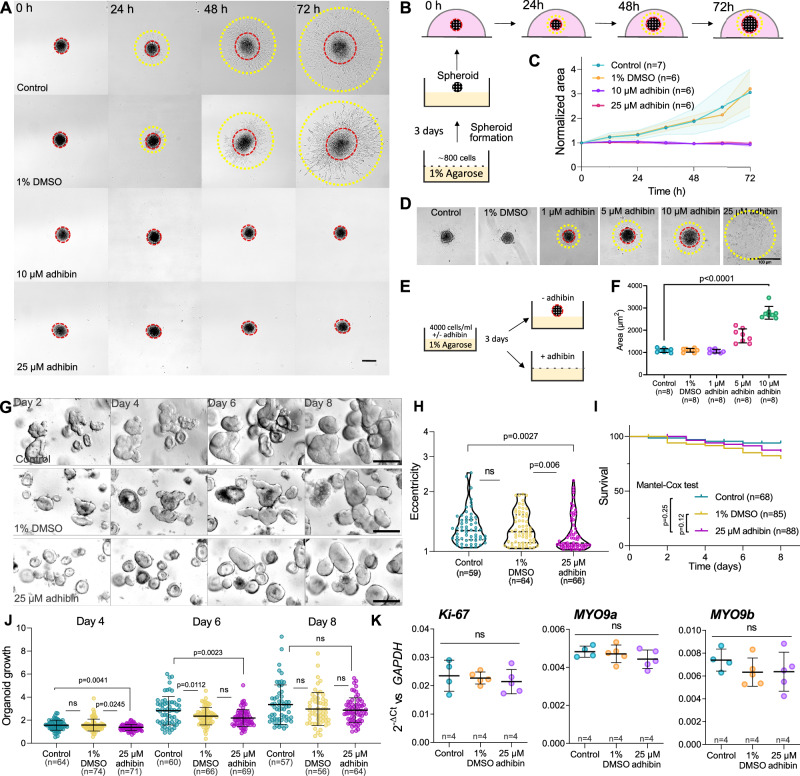
Fig. 9. Adhibin prevents 3D migration and spheroid formation and retards the growth and proliferation of human colonoids.
A 2D (yellow circle) and 3D migration (red circle) of 3D NIH-3T3 cells clumped in spheroids during 72 h in the presence and absence of adhibin. Scale bar: 200 µm. B Scheme describing the process of the spheroid formation, treatment and imaging. C Quantification of NIH-3T3 spheroid area during 72 h in the presence and absence of adhibin. n is the number of experiments. D Formation of NIH-3T3 spheroids in the presence and absence of adhibin. Scale bar: 100 µm. The experiment was reproduced eight times (see F for quantification). E Scheme describes the process of spheroid formation in the absence and presence of different adhibin concentrations. F Quantification of NIH-3T3 spheroid area formed (D) in the presence and absence of adhibin (one-way ANOVA), n is the number of experiments. G Representative images of colonoids at days 2-8 with different treatments. Scale bar: 10 μm. H Characterization of colonoid shapes for different conditions at day 6 based on eccentricity (1/circularity) (one-way ANOVA for multiple comparisons, two-tailed Mann–Whitney test for two-column comparison), n is the number of cells analysed. I Survival rate of colonoids. J Proportional growth (as determined by measuring cross-section area over time) of colonoids for each condition at days 4, 6, and 8 (two-tailed unpaired t-test or Mann-Whitney test), n is the number of cells analysed. K RT-qPCR analysis of colonoid cultures at day 6 after different adhibin treatments (one-way ANOVA), n is the number of experiments. All data are represented as mean ± S.D.

