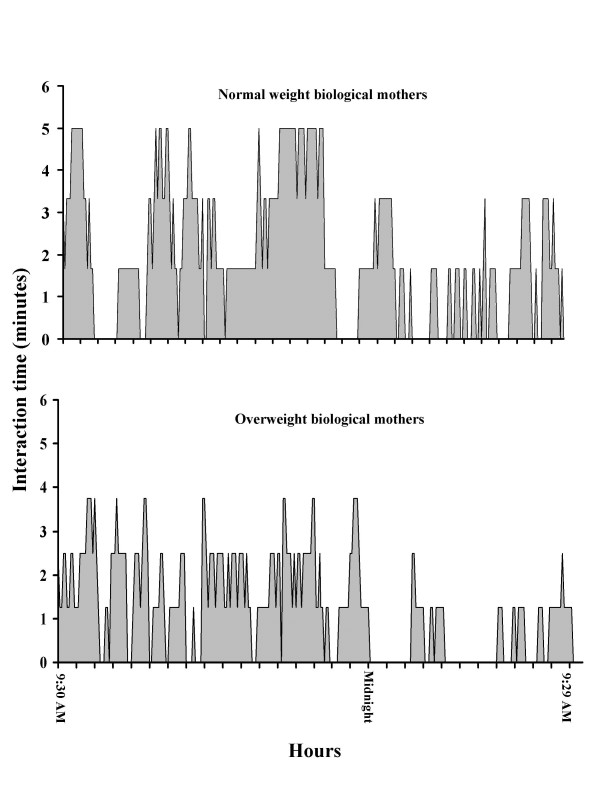
Figure 4.
Twenty-four hour interaction profile for infants born to normal (top) and obese (bottom) biological mothers. The Y-axis represents the mean amount of interaction time over each five minute period. There are 288 five minute summary periods during a 24-hour metabolic measurement. A Obese biological mothers spent less time (p < 0.05) interacting with their infants during the day (9:30 AM till 11:30 PM) than their normal weight counterparts. Similar differences occurred during the evening hours (11:31 PM till 5:30 AM) but the differences were not significant.

