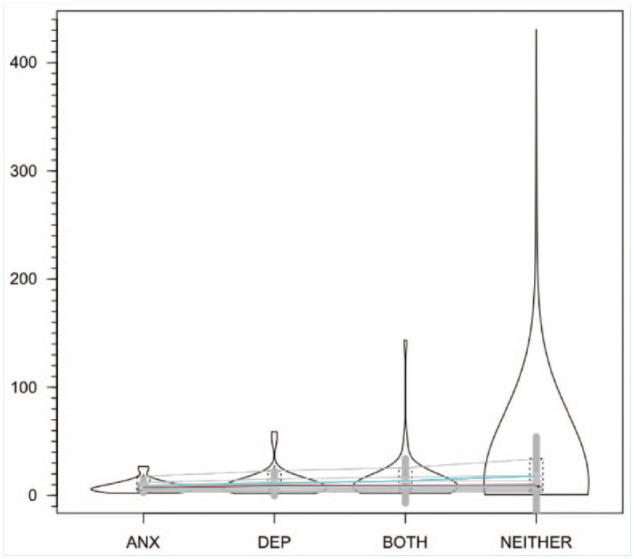
Figure 3.

Time until asymptomatic per BSI group. Violin plots are shown with colored lines connecting the medians (dark gray), averages (blue) and Huber’s robust estimates of the distribution centers (crimson), along with deciles connected by thin gray lines. ANX, anxiety; BSI, Brief Symptom Inventory; DEP, depression.
