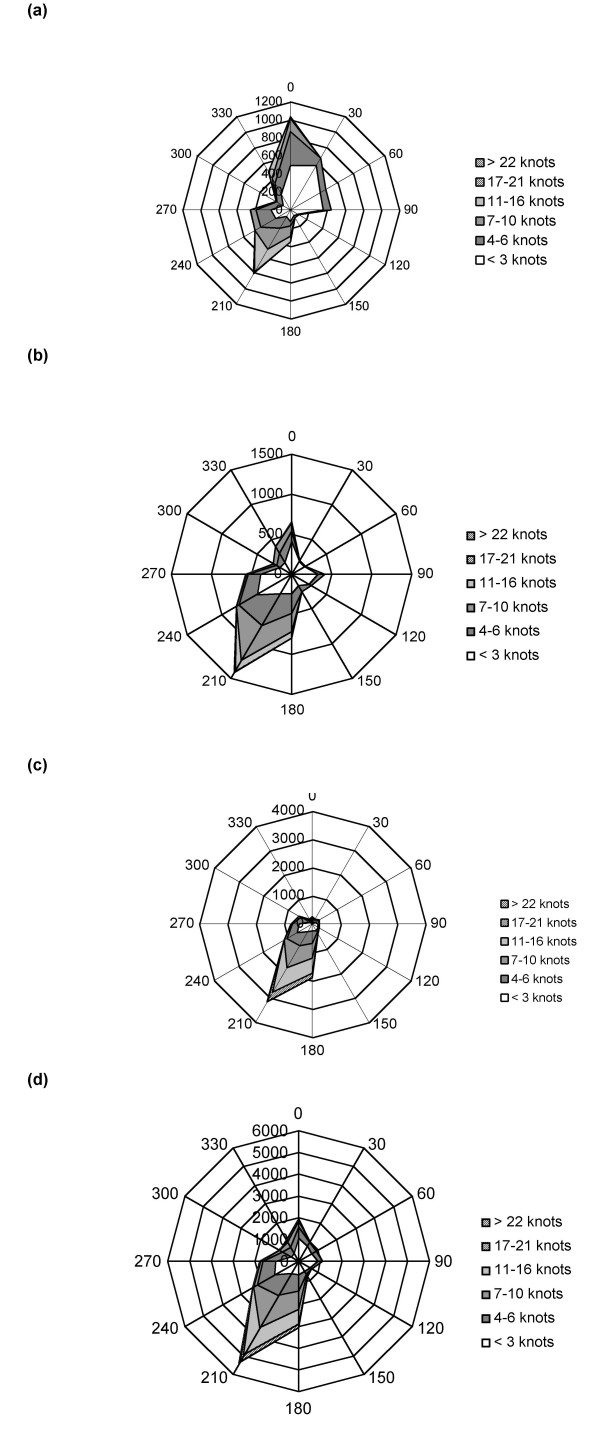
Figure 3.
Wind rose illustrating speed (knots) and direction of the wind every 15 minutes y-axis represents the number of 15 minute occurrences with the x-axis's representing direction in degrees. (a) Sampling before the closure of the blast furnace (1/6/00 – 25/6/00). (b) During the closure of the blast furnace (26/7/00 – 28/9/00). (c) Sampling after the blast furnace reopened (29/9/00–31/12/00) and (d) the total sampling period (1/6/00–31/12/00).

