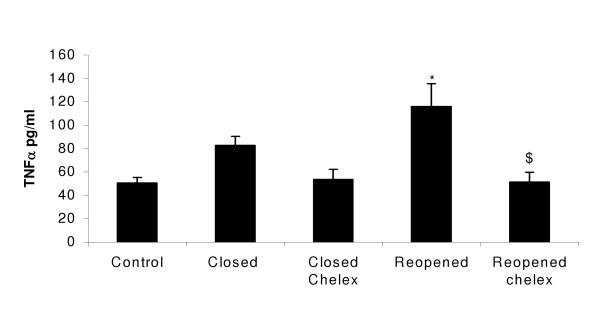
Figure 9.
TNFα protein production in J774.A1 cells treated for 4 hrs with Redcar PM10sample during and after the closure of the Corus plant and identical samples which underwent 4 hrs of chelating treatment. *p < 0.05 when compared to control, $p < 0.05 when compared to untreated reopened PM10 samples. Values represent the mean of 3 experiments ± SEM.

