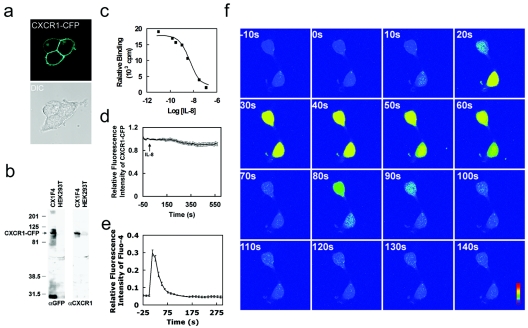
FIG. 1.
A stable HEK293 cell line expressing a functional CXCR1-CFP receptor. (a) Confocal images of living cells expressing membrane-localized CXCR1-CFP (cyan). (b) Fusion proteins of CXCR1-CFP were detected by Western blotting using anti-GFP (αGFP) monoclonal antibodies that cross-react with CFP and anti-CXCR1 monoclonal antibodies in whole CX1-HEK cell lysates. The positions of molecular mass markers (in kilodaltons) are shown to the left of the gel. (c) Binding curve of IL-8 with CXCR1-CFP receptors expressed in CX1-HEK cells. (d) Time course of CXCR1-CFP on the plasma membranes of living cells upon the stimulation of IL-8 (50 nM) using time-lapse live-cell confocal microscopy. CX1-HEK cells were illuminated with a 458-nm laser line for monitoring fluorescence signals from CFP. Frames were captured at 12-s intervals for more than 10 min. IL-8 was added at time zero. The entire plasma membrane was selected as the ROI, and the intensity of CFP fluorescence reflects the amount of CXCR1-CFP on the plasma membrane. The graph shows means and standard errors of the relative fluorescence (It/I0) as a function of time, where It is the intensity at any time point on the plasma membrane and I0 is the intensity at time zero. (e) IL-8-induced Ca2+ response in living CX1-HEK cells. IL-8 was added at time zero, and intracellular Ca2+ changes were detected as intensity changes of Fluo-4. Means ± standard errors (error bars) are shown (n = 12). (f) IL-8-induced Ca2+ response in two living CX1-HEK cells. IL-8 was added at time zero, and fluorescence images of transient intracellular Ca2+ elevation, detected as intensity changes of Fluo-4, are shown as rainbow pseudocolor. A color bar shows the relative intensity of Fluo-4. The time following IL-8 stimulation is shown in the upper left corner of each image. A video showing a complete sequence of this time-lapse experiment is available upon request.

