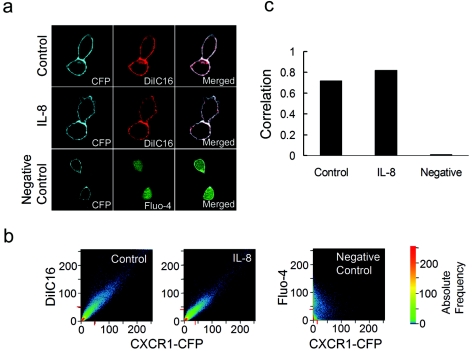
FIG. 2.
CXCR1-CFP and a lipid raft fluorescent dye, DiIC16, are colocalized on the plasma membrane regardless of IL-8 stimulation. (a) CX1-HEK cells were labeled with DiIC16 for 5 min. Labeled cells in the absence of IL-8 (control) or in the presence of IL-8 were visualized for CFP and DiIC16 with a confocal laser-scanning microscope. CX1-HEK cells labeled with Fluo-4 (green) are shown as a negative control of colocalization analysis. (b) Quantitative analysis of colocalization of two images expressed as a scatter diagram (LSM 510META software; Carl Zeiss). Identical images produce a clean diagonal line running from the bottom left to the top right. Differences between the images cause an irregular distribution in the scatter diagram (for example, CXCR1-CFP and Fluo-4 images of CX1-HEK cells labeled with Fluo-4 serve as a negative control). CXCR1-CFP and DiIC16 images, in the absence of IL-8 (control) and presence of IL-8, display similarly high degrees of colocalization. (c) Correlation coefficients of CXCR1-CFP and DiIC16 images with or without IL-8 show high degrees of colocalization, whereas CXCR1-CFP and Fluo-4 images show little colocalization. Correlation coefficients provide information on the intensity distribution within the colocalizing region. Values range from 0 to 1, with 1 indicating that all pixels are found on a straight line in the scattergram while 0 indicates that the pixels in the scattergram are distributed in a cloud.

