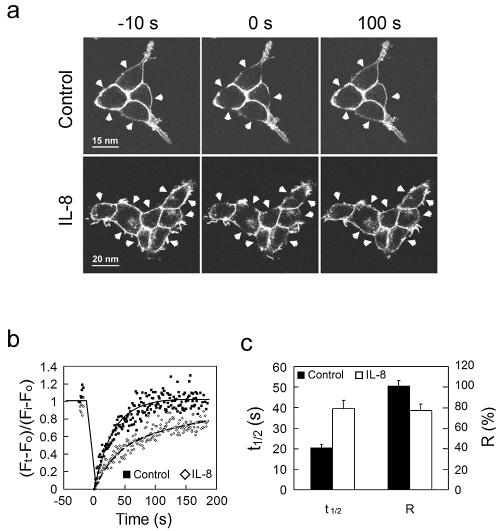
FIG. 4.
FRAP measurement shows that CXCR1-CFP's mobility becomes limited on the plasma membranes of live cells upon IL-8 stimulation. (a) FRAP experiment on the CX1-HEK cells in the absence (control) or presence of IL-8. Prebleach images (−10 s) and postbleach images (0 s and 100 s) are shown. Arrowheads indicate selected bleaching areas. (b) Quantitation and kinetics of CXCR1-CFP recovering on the plasma membrane after photobleaching. The mean fluorescence intensity of CXCR1-CFP in each selected area was determined at the times indicated and expressed as a ratio, (Ft − F0/Fi − F0). Ft is the mean intensity at any time point. F0 is the mean intensity immediately after bleaching. Fi is the mean intensity before bleaching. The black dots and solid line represent data from cells in the absence of IL-8, while the gray dots and dashed line are from cells in the presence of IL-8. (c) Kinetic parameters of CXCR1-CFP in FRAP experiments. T1/2 is the time for 50% recovery. A kinetic parameter of a protein can be discerned from quantitative studies using FRAP. The mobile fraction (R) is the fraction of fluorescent proteins that can diffuse into the bleached region during the time course of the experiment (20). We determined the R value as the percentage of fluorescence recovery at the last time point of the experiments. Data were obtained from 10 (control) and 16 (IL-8) independent experiments, respectively. Means ± standard errors (error bars) are shown. In the presence of IL-8, T1/2 is longer and R is smaller.

