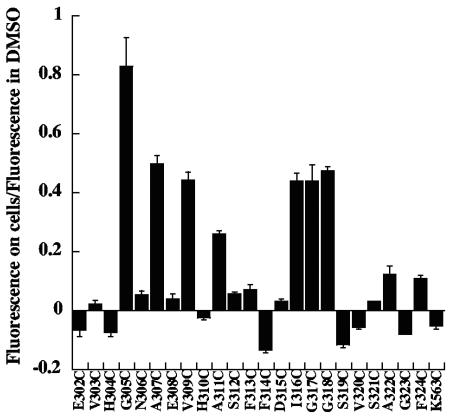
FIG. 3.
Relative change in fluorescence of cell-bound PA with NBD attached at various sites within the 2β2-2β3 loop. CHO-R1 ATR800 cells were incubated with the various labeled forms of PA and processed as described in the legend to Fig. 2. The bars represent the ratio between the fluorescence intensity of NBD on cells at 1 h and the fluorescence intensity of NBD in organic solvent (DMSO) for each mutant. Error bars represent standard deviations.

