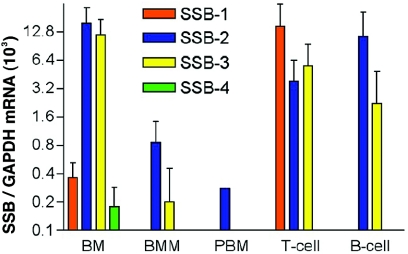
FIG. 5.
Expression of SSB family members in hematopoietic cell lineages. (A) SSB mRNA levels have been normalized against GAPDH mRNA. Bars represent means ± the standard deviations. The results for whole bone marrow (BM; n = 4), bone marrow-derived macrophages (BMM; n = 3), peripheral blood macrophages (PBM; n = 1), peripheral lymph node T cells (CD3+ve) (n = 3), and splenic B cells (B220+ve) (n = 3) are shown.

