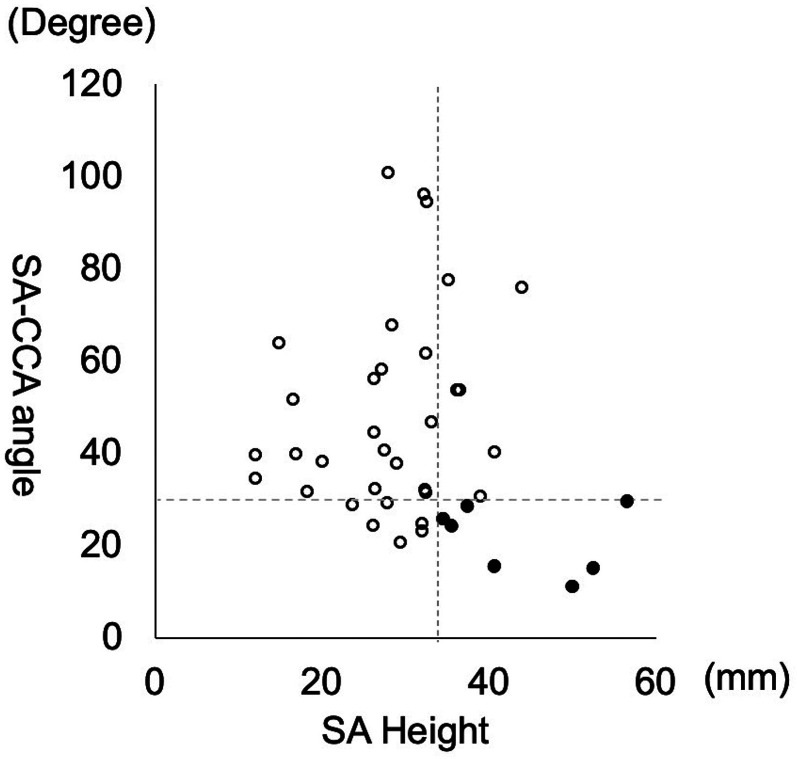
Figure 3.
Dot plot of the SA height and SA–CCA angle. The vertical dashed line indicates a cutoff value of 34 mm for SA height, and the horizontal dashed line indicates a cutoff value of 30° for the SA–CCA angle. Black dots represent difficult navigation cases, and white circles represent easy navigation cases.
SA: subclavian artery; CCA: common carotid artery.

