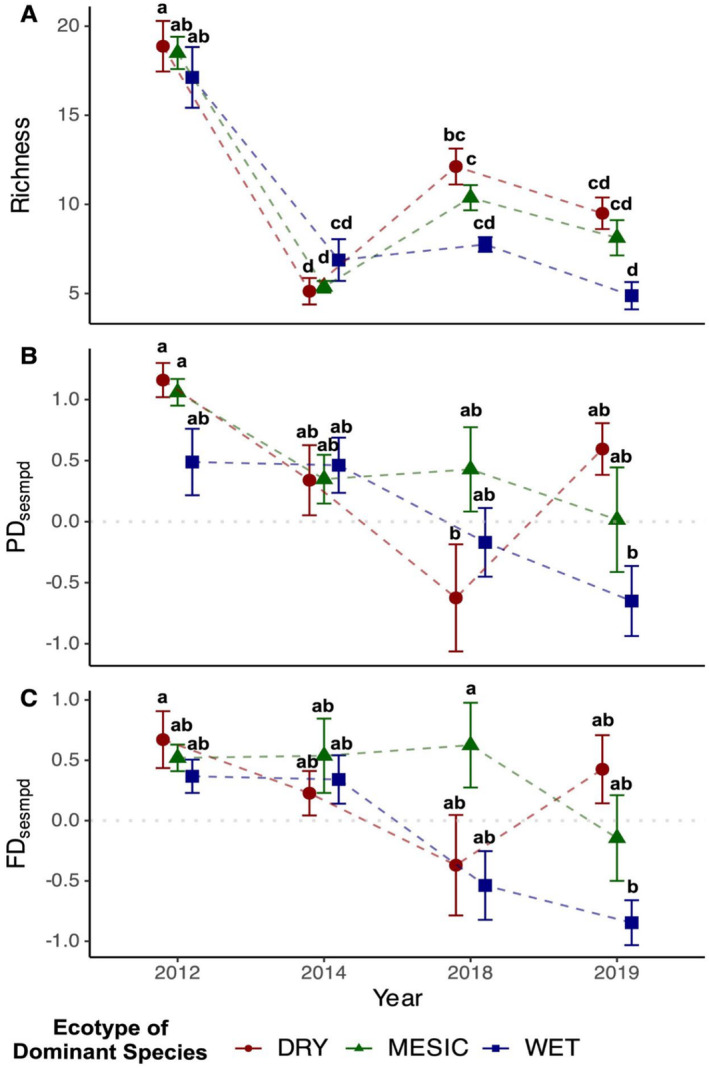
FIGURE 1.

Results showing the interactive effect of dominant grass ecotype (DRY, MESIC, or WET) and year (2012, 2014, 2018, or 2019) on (A) species richness (number of species m−2), (B) phylogenetic diversity (PDsesmpd), and (C) functional diversity (FDsesmpd). Values of metrics from the same year are horizontally jittered to aid visualization. Above data points and error bars sharing the same letter indicate nonsignificant differences (p > 0.05).
