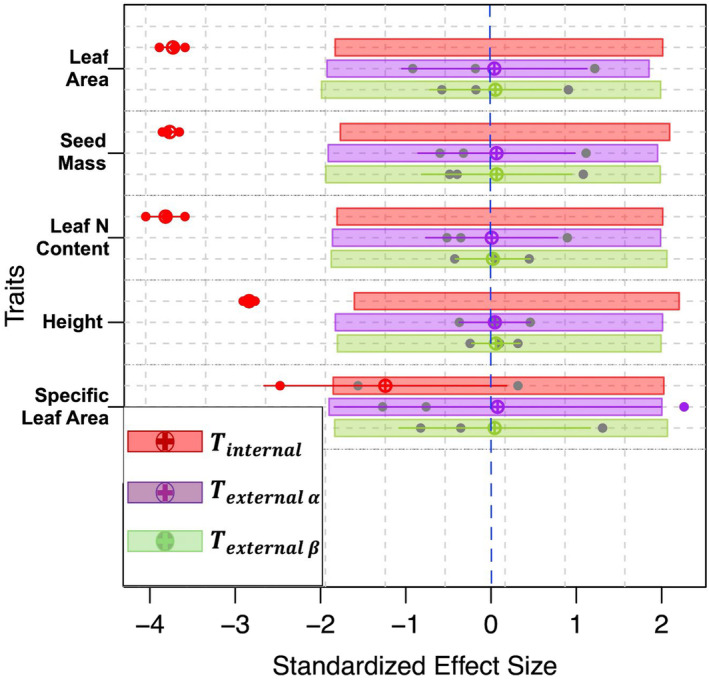
FIGURE 2.

Standardized effect size (SES) of T‐statistics for the five traits: leaf area (cm2), seed mass (mg), leaf N content (mg g−1), height (cm), and specific leaf area (cm2 g−1) collected from the common garden experiment. The horizontal axis (SES) was employed to quantify the magnitude of changes, enabling comparison across distinct trait measures. Colored dots represent the SES value for plots planted with one dominant species ecotype (e.g., DRY, MESIC, or WET) when different from the null model. Tinternal = the ratio of trait variance within ecotype (e.g., intraspecific variation of WET ecotype for dominant species) relative to total trait variance within the plot (e.g., including both intraspecific and interspecific variations); T external α = the ratio of trait variance within a plot relative to trait variance of all plots in the common garden experiment; and T external β = the ratio of trait variance within a plot relative to trait variance of all plots in the common garden experiment, excluding intraspecific trait variation. The crossed circles and the segments represent the mean and standard deviation of the SES values for a given T‐statistic and a given trait. For a given T‐statistic, the mean SES (crossed circle) is significantly different from the null distribution if not embedded within the colored bar (e.g., ). The more the SES value departs from the null model, the stronger the filtering effect.
