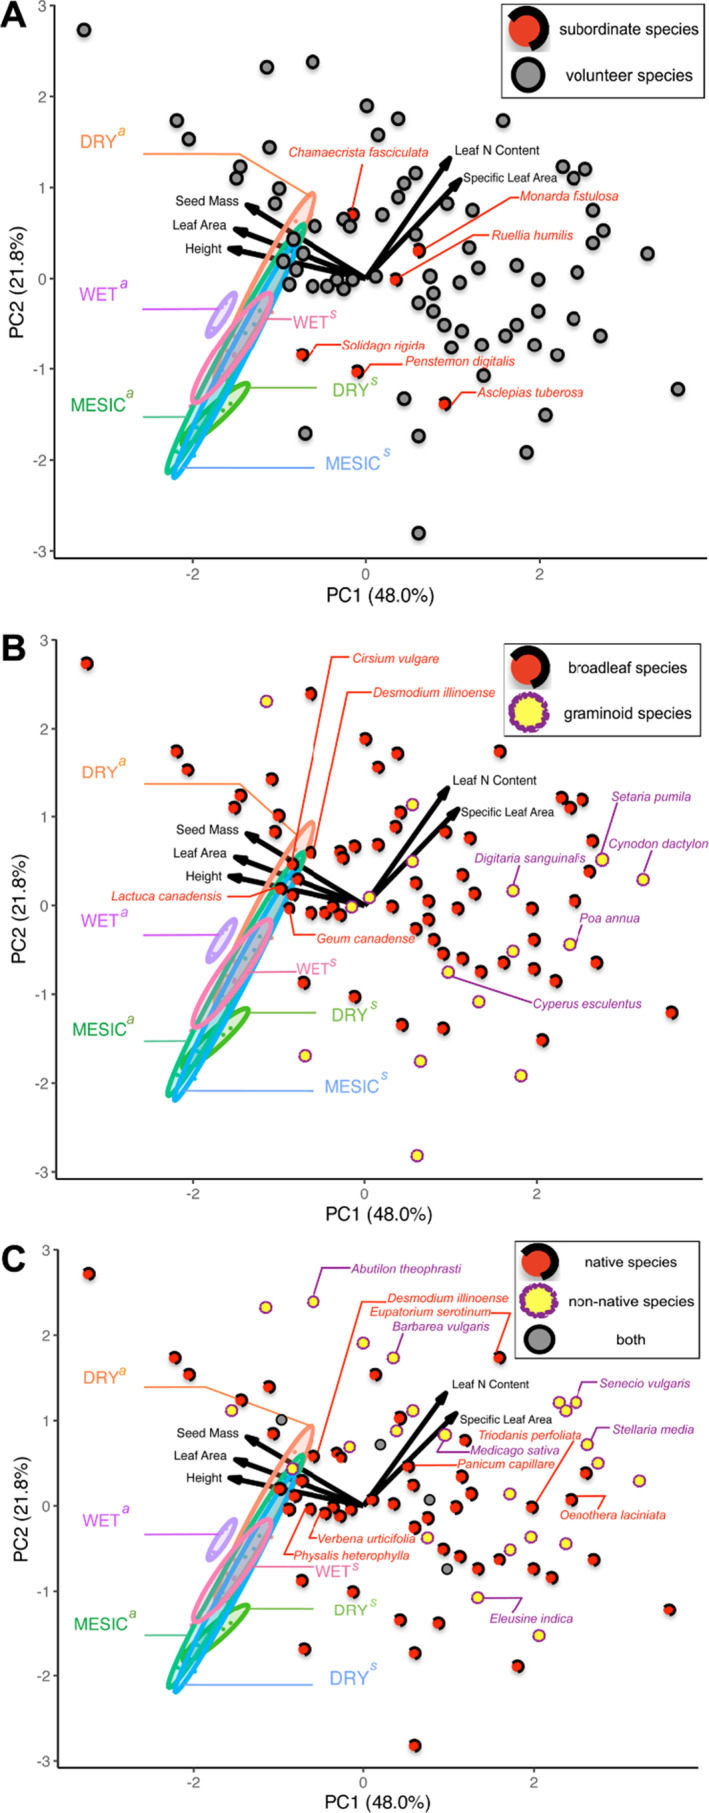
FIGURE 3.

Principal components analysis (PCA) summarizing ITVs among ecotypes (DRY, MESIC, or WET) of dominant species (a = Andropogon gerardi ; s = Sorghastrum nutans ) in multivariate trait space. The ellipses are 68% data ellipses for A. gerardi and S. nutans . Dots represent the positions of nondominant species within PCA trait space grouped by (A) their roles in communities: red dots with dashed circles = subordinate species sown with A. gerardi and S. nutans in 2008 (Table 1); gray dots with solid circles = volunteer species, (B) their morphological features: red dots with dashed circles = broadleaf species; yellow dots with rough circles = graminoid species, and (C) their nativeness: red dots with dashed circles = native species; yellow dots with rough circles = non‐native species; and gray dots with solid circles = species can be both native and non‐native. Information on whether a species is native or non‐native to Illinois, USA was obtained from the US Department of Agriculture (USDA) PLANTS Database (https://plants.usda.gov). Representative species are labeled with their scientific names: subordinate (red) in A, broadleaf (red) or graminoid (purple) in B, and native (red) or non‐native (purple) in C. The solid arrowed lines show the direction and loadings of the traits including height, leaf area, seed mass, leaf N content, and specific leaf area.
