

Abstract
Anthropogenic climate change has resulted in a significant rise in extreme heat events, exerting considerable but unequal impacts on morbidity and mortality. Numerous studies have identified inequities in heat exposure across different groups, but social identities have often been viewed in isolation from each other. As children (5 and under) and older adults (65 and older) face elevated risks of heat-related health impacts, we employ an intersectional cross-classificatory approach to analyze the distribution of heat exposure between sociodemographic categories split into age groups in the contiguous US. We utilize high-resolution daily air temperature data to establish three census tract-level heat metrics (i.e., average summer temperature, heat waves, and heat island days). We pair those metrics with American Community Survey estimates on racial/ethnic, socioeconomic, and disability status by age to calculate population weighted mean exposures and absolute disparity metrics. Our findings indicate few substantive differences between age groups overall, but more substantial differences between sociodemographic categories within age groups, with children and older adults from socially marginalized backgrounds facing greater exposure than adults from similar backgrounds. When looking at sociodemographic differences by age, people of color of any age and older adults without health insurance emerge as the most exposed groups. Results of this study help to identify groups who are most exposed to extreme heat. Policy and program interventions aimed at reducing the impacts of heat should take these disparities in exposure into account to achieve health equity objectives.
Keywords: Heat, age, vulnerability, environmental injustice, intersectionality
1. INTRODUCTION
Anthropogenic climate change is causing an increase in the intensity, frequency, and duration of extreme heat events (EHEs) across the world, along with warmer summer temperatures (Perkins-Kirkpatrick & Lewis, 2020; Philip et al., 2023; Philip et al., 2022). EHEs that were rare a few decades ago are now occurring with increased frequency (Fischer et al., 2021; Zachariah et al., 2023). Heat records are being broken seemingly every year, with the past eight years being the hottest on record globally (NOAA, 2023; World Meteorological Organization, 2023).
This increase in EHEs represents more than just a meteorological change; exposure to extreme heat has significant implications for human health. Heat is the leading cause of weather-related fatalities in the US, causing more deaths over the past 30 years than flooding and tornadoes combined (National Weather Services, 2022). In addition to influencing all-cause mortality, extreme heat can lead to cardiovascular and respiratory morbidity and mortality as well as negative mental health outcomes (Weilnhammer et al., 2021).
Research on environmental harm often addresses issues such as exposure, sensitivity, vulnerability, and risk, but these terms are used inconsistently. Here we employ the term exposure to refer to the degree and frequency of people’s experiences with heat (Morello-Frosch et al., 2011), sensitivity to describe the biological susceptibility to heat-related health effects (Morello-Frosch et al., 2011), and the term vulnerability to describe social factors which influence people’s experiences with and responses to heat (Morello-Frosch et al., 2011). Studying disasters, Blaikie theorized risk to be a product of vulnerability and exposure (Blaikie et al., 2014). Drawing from their approach, we consider heat risk to be the product of exposure, vulnerability and sensitivity. Additionally, we use the term heat to refer to actual temperatures (e.g., land or air surface temperature) and heat waves to refer to periods of time in which temperatures exceed a threshold indicating unusually high levels (Kent et al., 2014; NOAA, 2022; Xu et al., 2016). We use heat islands to refer to temperatures that are hotter in one place than the surrounding areas (Hsu et al., 2021).
While global in scope, the impacts of climate change, including from EHEs, are socially and spatially uneven. Scholarship continues to identify disparities in how different populations experience heat in the US. In terms of age, disproportionate exposure to heat among older adult populations, typically classified as 65 and older, has been infrequently examined, with a limited number of studies showing similar exposure levels for older and working-age adults (Mitchell & Chakraborty, 2015; Renteria et al., 2022; Voelkel et al., 2018). However, studies consistently show heightened sensitivity and vulnerability to heat among older adults, who face an elevated risk of heat-related illnesses (Benmarhnia et al., 2015; Meade et al., 2020; Ou et al., 2023) and mortality following EHEs (Henderson et al., 2022; Kohon et al., 2024). Although the current body of literature suggests increased susceptibility of older adults to the effects of heat, research on disproportionate exposure remains inconclusive. Further research on age-related differences in heat exposure is needed, particularly on a national scale. This is important as scientists predict that areas where older adults more commonly live, both in the US and globally, will experience disproportionate climate change-driven rises in temperature (Carr et al., 2024; Falchetta et al., 2024).
Unlike the older adult population, patterns of greater exposure for children have been documented in specific cities and regions, like Chicago, New York, Los Angeles (Mitchell & Chakraborty, 2015), Portland (Voelkel et al., 2018) and the Northeastern United States (Renteria et al., 2022). Children are biologically more sensitive to heat than adults due to thermoregulation instability, and they experience an increase in heat-related illnesses and exacerbated health issues relative to adults (Sheffield et al., 2018; Stanberry et al., 2018).
The evidence for racial/ethnic inequities in heat exposures is consistent, with racial and ethnic minorities experiencing higher temperatures (Renteria et al., 2022), more frequent heat waves (Rastogi et al., 2023), and higher likelihood of residing in heat islands (Chakraborty et al., 2019; Hsu et al., 2021) as compared with non-Hispanic White Americans in the US. This has held true on a national scale (Benz & Burney, 2021; Rastogi et al., 2023), as well as regionally (Renteria et al., 2022) and locally (Chakraborty et al., 2019; Voelkel et al., 2018). These disproportionate exposures, in combination with social vulnerability, likely contribute to health disparities. Indeed, racial/ethnic minority groups are more likely to experience negative heat-related health impacts as compared to non-Hispanic White Americans (Berberian et al., 2022), including pregnancy-related cardiovascular complications, myocardial infraction hospitalizations, and asthma-related emergency room visits (Figgs, 2019; Fisher et al., 2017; Ha et al., 2017).
Research has consistently identified a link between low socio-economic status and disproportionate heat exposure (Benmarhnia et al., 2015; Hsu et al., 2021). Studies across the US have demonstrated this association when using Land Surface Temperature (LST) (Benz & Burney, 2021; Chakraborty et al., 2019; Renteria et al., 2022) as well as one study using heat wave intensity based on air temperature (Rastogi et al., 2023). Within the United States, lacking health insurance status can represent low socioeconomic status. Although rarely studied as a sole correlate of heat exposure, insurance status has been included in heat vulnerability indices (Christenson et al., 2017; Méndez-Lázaro et al., 2018). Lower socioeconomic status can be a risk factor for heat-related illness (e.g., Madrigano et al., 2013) due to lower baseline health and nutrition status, greater social isolation, lack of access to air conditioning, and inadequate health care access (Gronlund, 2014; Jessel et al., 2019).
Despite being frequently identified as a vulnerable group, only a couple of sub-national studies have examined associations between any disability status (e.g., functional, hearing and vision, and cognitive) and heat exposure. These case studies on heat exposure and disability status yield inconsistent findings. Disability status was positively correlated with urban heat islands in New York, Chicago, and Los Angeles, but a significant predictor in a multivariable model only in Los Angeles (Mitchell & Chakraborty 2015). In the northeastern US, tract level composition of persons with disabilities was not associated significantly with LST in a multivariable model (Renteria et al. 2022). While there is heterogeneity in how heat harms the health of people with varying disabilities, it is generally the case that individuals with disabilities face greater potential harm from extreme heat due to associated comorbidities (Bouchama et al., 2007; Cheshire, 2016), social isolation, physical mobility, and housing inequities (Kosanic et al., 2022).
As an individual’s identities are multifaceted (e.g., being older and Black), it is beneficial to consider sociodemographic factors in combination when examining heat risk. However, most heat exposure studies analyze social groups in isolation from each other rather than taking an intersectional approach. An intersectional approach considers how multiple social identities intersect at the microlevel of the individual to reflect interlocking systems of privilege and oppression (e.g., racism, classism, ageism) at the macro social-structural level (Zota & VanNoy, 2021). While some have created heat vulnerability indices that include multiple social categories in the same metric (e.g., Méndez-Lázaro et al., 2018), those approaches do not tease out differences in vulnerability for groups with multiple identities. To accomplish this, analysts can use a cross-classification approach (Bauer & Scheim, 2019; Gustafsson et al., 2022; Liu et al., 2023). This involves operationalizing intersectional identities such that combinations of social positions are considered (Zelazo et al., 2013), e.g., older aged and Black, older aged and Hispanic, middle aged and Black, and middle aged and Hispanic.
To address existing gaps in the literature, we examine heat exposure disparities for sociodemographic categories (e.g., race/ethnicity, insurance status, poverty, and disability) by age (e.g., children, adults, and older adults) in the US (during 2015–2019). In doing so, we make three key contributions. First, we comprehensively examine age as a correlate of heat exposure in the entire US. As older adults and children are at greater risk for heat sensitivity, it is important to examine disparities in exposure based on age. To date, few studies have done this at the national level. Second, we take an intersectional approach to examine how other demographic factors (e.g., socioeconomic status and disability) intersect with age. Third, we examine multiple measures of heat exposure, derived from air temperature, in the same analysis. Peoples’ experiences with heat are multifaceted. The actual air temperature matters, but so does the duration of hot temperatures (e.g., heat waves) and experiencing temperatures that are hotter than those in the surrounding county (e.g., heat islands). Each of the included metrics capture a different element of how heat is experienced. Our measures derive from air temperature as opposed to LST, which is more commonly used (see only Rastogi et al., 2023 for an exception). While easily obtainable from satellite data, LST overestimates heat intensity and provides less accurate measurements of heat exposure than air temperature measurements (Hsu et al., 2021; Mutiibwa et al., 2015). Research using air temperature is also more closely tied to policy applications as temperature values used to determine excessive heat warnings and emergency protocols are based on air temperature rather than LST.
2. MATERIALS & METHODS
This study looks at the heat exposure and demographics of individuals living in the contiguous United States using 2015–2019 American Community Survey (ACS) 5-year estimates for census tracts (n=72,424). As compared to 1-year estimates, we used 5-year estimates as they have reduced sampling error (U.S. Census Bureau, 2022). Five-year ACS estimates are commonly used in this type of research (Benz & Burney, 2021; Hsu et al., 2021). To establish 98th percentile values (used to delineate extreme heat), we drew on heat data from 2000 through 2019. Our heat variables (as described below) pertain to 2015–2019 to match the ACS estimates.
2.1. Heat Data and Variables
For daily temperatures, we used heat data from the Parameter-Elevation Regressions on Independent Slopes Model (PRISM) (PRISM Climate Group, Oregon State University, 2023). This model provides 800-meter gridded daily meteorological estimates, including air temperature, across the US (Daly et al., 2008). PRISM800, and other similar gridded climate models, take climate data from monitoring stations in combination with other variables in order to estimate the climate data for each cell on a grid.
To estimate the value for each 800 m grid cell, PRISM draws temperature data from 10,000 weather stations. For each grid cell, PRISM assimilates observations from 15–25 nearby weather station locations. The influence of each station is determined based on its distance from the grid cell and its physiographic and climatic similarity to the grid cell. The physiographic similarity between the station and the grid cell is determined by elevation, proximity to a coastline, aspect, topographic position and atmospheric layer (Daly et al., 2002; Daly et al., 2008; Daly & National Center for Atmospheric Research Staff 2023; Strachan & Daly, 2017). While there are other gridded climate products available, we use PRISM800 for several reasons.
First, PRISM provides air temperature values instead of land surface temperature. Even though LST is commonly used in heat disparities research (Benz & Burney, 2021; Chakraborty et al., 2019; Hsu et al., 2021; Mutiibwa et al., 2015), air temperature is a more accurate representation of the temperature that people experience as opposed to LST which measures the ground temperature. Additionally, air temperature data are not limited by cloud cover, which is a limitation of remotely sensed LST inputs, which are derived using satellite data). This is also a downside to Zhang et al.’s (2022) Spatially Varying Coefficient Models with Sign Preservation (SVCM-SP) temperature grid as it uses LST. A strength of the SVCM-SP is that it can show urban heat islands worldwide, but only in cities with clear weather (Zhang et al., 2022).
Second, the high spatial resolution of PRISM 800 is a key strength (Daly & National Center for Atmospheric Research Staff 2023), along with its accuracy in areas with complex terrain (e.g., mountain valleys). While their resolution is still fine-scale, the SVCM-SP (Zhang et al. 2022) and Daymet (Thorton et al., 2021) are at a 1 km resolution, which is slightly less favorable when analyzing small areas (e.g., census tracts). Using larger pixels (especially the 4 km resolution of the PRISM public data release) to assign heat values to tracts would result in more frequent exposure misclassification. Third, PRISM produces daily air temperature values, a higher temporal resolution than the 8-day and monthly averages produced by the Global Seamless High-resolution Temperature Dataset (GSHTD), which is another data source that addresses limitations of cloud cover associated with LST (Yao et al. 2023).
Finally, PRISM800 data are accurate, of high quality, and appropriate for this study with its US focus as PRISM is designed to capture spatial climate patterns in the US (Daly et al 2007). PRISM heat data are commonly used in other studies (Bernstein et al., 2022; Spangler et al., 2019; Weinberger et al., 2019; Williams et al., 2020). A strength of PRISM is its accuracy in mountainous areas (Daly & National Center for Atmospheric Research Staff 2023), yet PRISM has also been used to create an urban heat island variable (Debbage & Shepherd, 2015) and to validate other temperature datasets in urban contexts (Sarangi et al., 2021; Yin et al., 2023). In comparing PRISM temperature estimates to recorded temperatures across the conterminous U.S., PRISM had r2 values greater than 0.94 with a mean absolute error of less than 1.6 ° F, suggesting that PRISM data are accurate. In this, PRISM outperformed Daymet, which had mean absolute errors as high as 2.7 ° F (Spangler et al., 2019). Although Zhang et al. (2022) did not compare the SVCM-SP directly to PRISM, PRISM is likely more accurate than the SVCM-SP, which had accuracy metrics that were similar to Daymet (Zhang et al. 2022). In terms of quality, PRISM staff conduct expert evaluation and quality control of station data (Daly & National Center for Atmospheric Research Staff 2023).
To capture various facets of heat exposure, we used three heat variables to represent summertime temperature, heat waves, and heat islands. All three derive from daily temperature data provided by PRISM. Although studies on human physiology show that humidity plays an important role in heat strain, epidemiological studies often do not find an association between humidity and heat related morbidity and mortality (Armstrong et al., 2019; Baldwin et al., 2023). As such, our heat variables rely on dry bulb temperature and not wet bulb temperature. We transformed the daily gridded data into daily tract and county level data for the contiguous United States using zonal statistics. Zonal statistics allocate values for polygons (tracts or counties) based on averaging the values of grid cells within each polygon.
First, we used the summertime daily mean temperature (May to September) in each tract for the study period of 2015 through 2019 (Figure 1), as opposed to an annual heat metric. We did this because a majority of extreme heat occurs during the summer months. Additionally, the interpretation of the annual average would be complicated by areas that experience extreme cold relative to areas with more moderate wintertime temperatures.
Figure 1.

Mean daily summer temperature in °C in US census tracts (n=72,424)
To create the second and third metrics, we defined “extreme heat” using a percentile threshold of ≥98%. Although extreme heat can be identified using either an absolute or percentile-based threshold for temperature (Rastogi et al., 2020; Shiva et al., 2019), we used place-specific percentiles as our study area is the contiguous US and heat norms vary greatly from place to place. We averaged all summertime daily average temperatures from 2000–2019 for each county and used the 98th percentile as the cut point for extreme heat. We completed the same process for each census tract. We employed the tract’s 98th percentile in the tract-level heat wave metric and the county’s 98th percentile in the tract-level heat island metric, both to be described next.
Using the tract 98th percentile threshold, we calculated the tract-level number of heat waves during 2015–2019. Heat waves were defined as a period of two or more consecutive days where the mean tract temperature equaled or exceeded the tract-specific 98th percentile of summertime temperatures [based on measurements from 2000–2019] (Kent et al., 2014) (Figure 2). Relatedly, we calculated, for a supplemental analysis, the sum of days during summer months in 2015–2019 when the average temperature in a tract was ≥ 98th percentile [2000–2019] for that tract (See Figure A, supplemental material). As much of the literature around heat impact is focused on urban heat islands, we examined the sum of heat island days during summer months in 2015–2019 (defined as the sum of days when the average temperature in a tract was ≥ 98th percentile [2000–2019] for that tract’s host county) (Ragettli et al., 2017) (Figure 3). Descriptive statistics for the tract-level heat variables are included in Table 1.
Figure 2.

Number of heat waves in US census tracts from 2015 through 2019 (n=72,424).
Heat waves are defined as ≥2 days when the average temperature in a tract was ≥98th percentile [2000–2019] for that tract.
Figure 3.
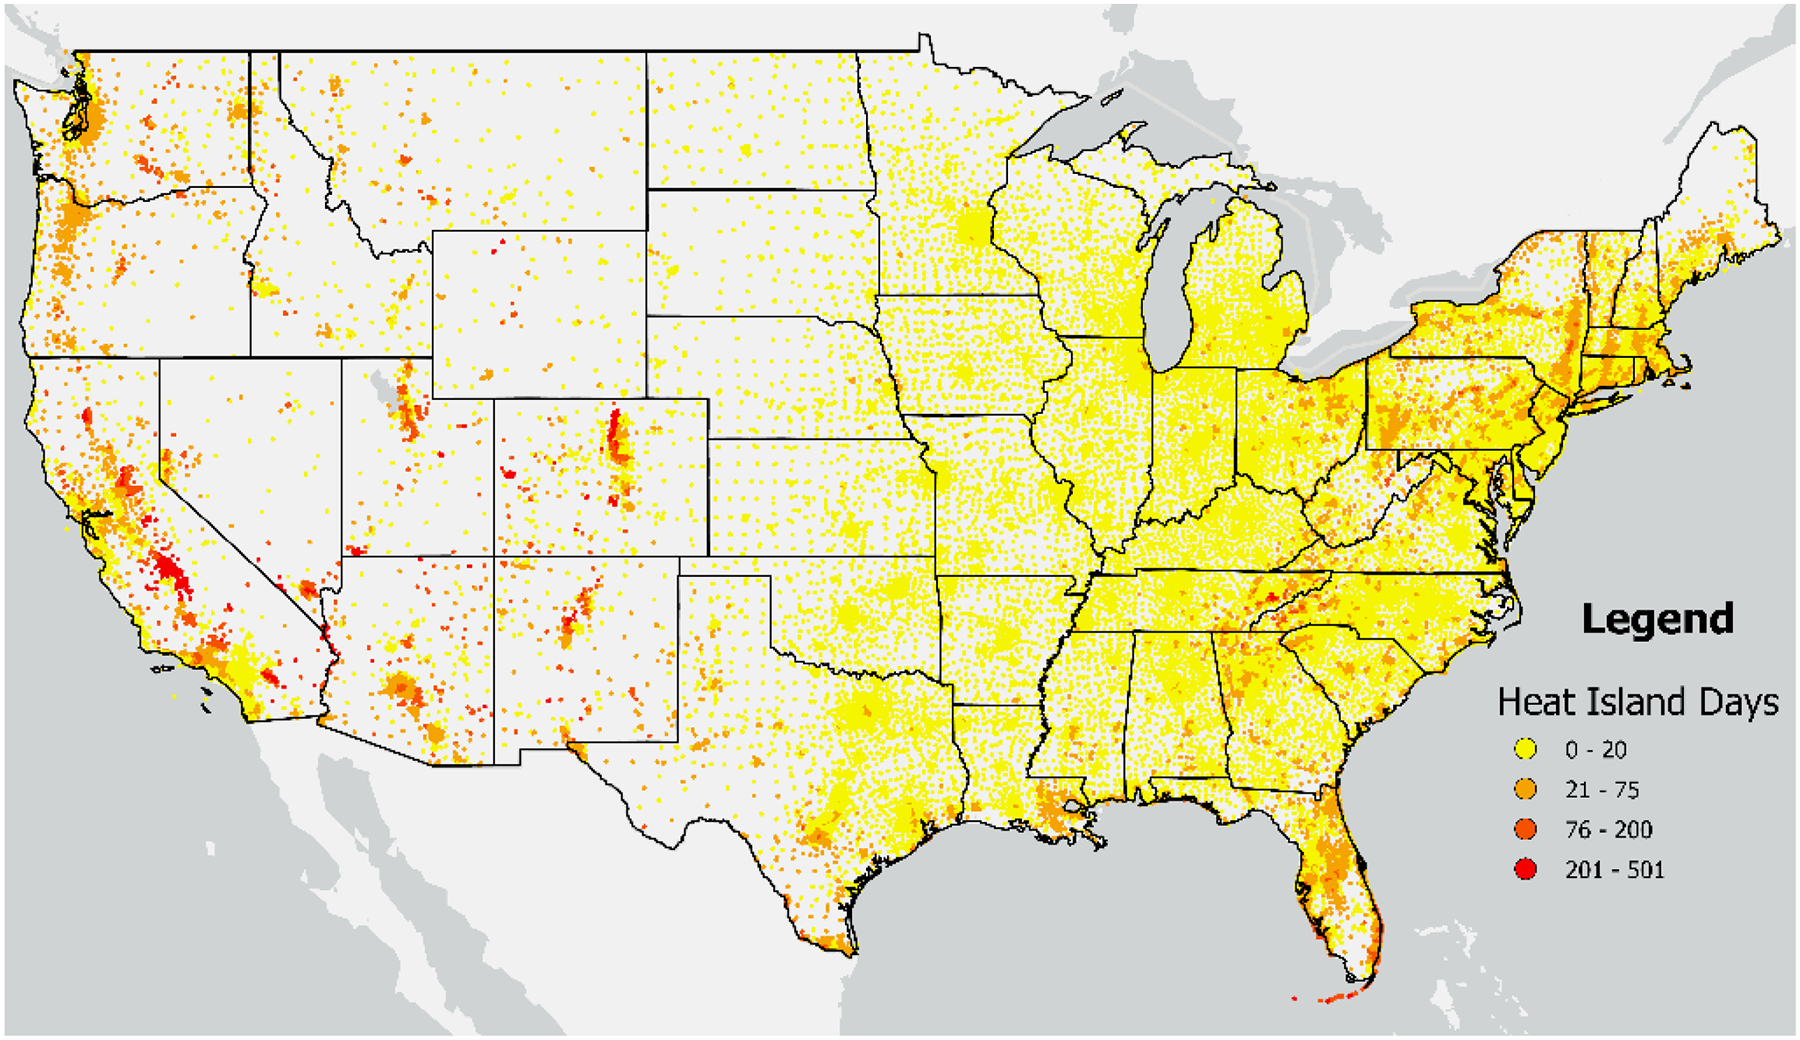
Number of heat island days in US census tracts from 2015 through 2019 (n=72,424).
Heat island days are defined as the sum of days when the average temperature in a tract was ≥ 98th percentile [2000–2019] for that tract’s host county.
Table 1.
Descriptive Statistics2
| Population-Weighted | ||||||||
|---|---|---|---|---|---|---|---|---|
| Sum1, All Ages | Sum1, Children | Sum1, Adults | Sum1, ≥65 yrs | Min. | Max. | Mean | St. Dev | |
| RACE/ETHNICITY | ||||||||
| Total | 342,847,389 | 79,613,582 | 211,593,664 | 51,640,143 | ||||
| White Alone Non-Hispanic | 196,268,598 | 37,041,191 | 120,300,280 | 38,927,127 | ||||
| Persons of Color | 146,578,791 | 42,572,391 | 91,293,384 | 12,713,016 | ||||
| POVERTY | ||||||||
| Total | 314,596,676 | 71,751,263 | 193,688,281 | 49,157,132 | ||||
| Not in poverty | 272,300,007 | 58,438,626 | 169,266,388 | 44,594,993 | ||||
| In poverty | 42,296,669 | 13,312,637 | 24,421,893 | 4,562,139 | ||||
| HEALTH INSURANCE | ||||||||
| Total | 317,610,273 | 77,194,978 | 191,258,089 | 49,157,206 | ||||
| With health insurance | 289,516,816 | 73,277,071 | 167,473,047 | 48,766,698 | ||||
| No health insurance | 28,093,457 | 3,917,907 | 23,785,042 | 390,508 | ||||
| DISABILITY | ||||||||
| Total | 317,610,273 | 72,800,638 | 195,652,429 | 49,157,206 | ||||
| No disability | 277,518,210 | 69,732,135 | 175,578,511 | 32,207,564 | ||||
| With any disability | 40,092,063 | 3,068,503 | 20,073,918 | 16,949,642 | ||||
| HEAT | ||||||||
| Average daily summer temperature, °C | 8.6 | 33.2 | 22.8 | 3.4 | ||||
| Heat waves, # | 0 | 16 | 3.8 | 2.4 | ||||
| Heat island days, # | 0 | 501 | 26.6 | 39.8 | ||||
Summed values derive from counting all group members living in included census tracts in the CONUS study area (n=72,424).
Variables pertain to 2015–2019
2.2. Sociodemographic Data and Variables
We used sociodemographic variables from the 2015–2019 5-year tract-level American Community Survey estimates. To operationalize intersectional identities such that combinations of demographic factors and social positions are considered (Zelazo et al., 2013), we used a cross-classification approach. This approach is conventional in intersectional health research (Bauer et al., 2021; Mena & Bolte, 2019) and frequently used (Bauer & Scheim, 2019; Grineski et al., 2023; Gustafsson et al., 2022; Liu et al., 2023). Specifically, we cross-classified the three age groups by the four demographic variables of interest to create sets of intersectional strata. When possible, we use the same age categories, but the ACS data do not always perfectly align. For race/ethnicity, poverty and disability, the ACS uses the following age breakdowns: <18, 18–64 and ≥65. For insurance status, the age groups are ≤18, 19–64 and ≥65. For a supplemental analysis, we also cross-classified race/ethnicity, insurance status and disability for an additional (fourth) age group of ≥75 (see Table A [supplemental material] for descriptive statistics).
We consider race/ethnicity by age of individuals (Census Bureau data tables B01001A- B01001I). We obtained counts of people (by age group) per tract who are Non-Hispanic White relative to all persons of color or POC (defined as either Hispanic or any other non-White race or combination of races). We examined a single dichotomous category for race/ethnicity because ACS does not report race and ethnicity by age in mutually exclusive categories. We created more specific racial/ethnic categories for use in a supplemental analysis, but the categories are not mutually exclusive as Hispanic persons are double counted in all non-White categories (see Table B [supplemental material] for descriptive statistics).
We also consider poverty status by age of individuals (Census Bureau data table [CBDT] S1701_C01), using the counts of people per tract that are in poverty or not; disability status by age of individuals (CBDT C18108) in terms of counts of people that have any disability or not; and insurance status by age of individuals (CBDT B27001) in terms of counts of people that are insured (any source) or not. Table 1 provides descriptive statistics of all variables used in the analysis.
2.3. Analysis Methods
Following others (Collins & Grineski, 2022; Liu et al., 2021), we calculated population-weighted mean exposure (PWME) and an absolute disparity metric. We determined the PWME for each cross-classified group (i.e., demographic characteristic by age group) as well as for all people in each age bracket. We used the following formula: PWME= Σ (Group population in each tract*Exposure in each tract)/ Σ (Group population in each tract) (Collins & Grineski, 2022; Liu et al., 2021). For each PWME, we report the population-weighted standard error as well. To compare group-specific PWME, we conducted independent samples t-tests to determine if there were statistically significant differences between the population-weighted means of each cross-classified group (e.g., comparing poor children vs nonpoor children). To run the t-test, we input the population-weighted mean, the population-weighted standard deviation, and the effective sample size for each group. As we examined multiple analyses using the same data, there was a risk of erroneously rejecting a null hypothesis. Therefore, we adjusted our p-values to determine statistical significance using Bonferroni adjustment for multiple comparisons, which is quite conservative (Chen et al 2017). This method seeks to control the familywise error rate, or the probability of incorrectly rejecting at least one null hypothesis. The p<0.05 significance test level becomes p<0.001 as we apply the Bonferroni adjustment with forty-eight comparisons (i.e., 0.05/48). The forty-eight comparisons stem from four age groups, four sociodemographic variables, and three dependent variables. Even when applying an adjusted p-value, nearly all findings were statistically significant. For that reason, we considered substantive differences in PWME between groups to be ≥0.1 standard deviation. These values are 0.34 °C for temperature, 0.24 for heat waves and 3.98 for heat island days.
To quantify the degree of disparity between the race/ethnicity, poverty, insurance, and disability groups with the highest and lowest PWME by age, we calculated an absolute disparity metric for each age bracket using the formula: 100*(highest PWME–lowest PWME)/total PWME (for all groups combined). We consider ≥15% to be a substantive absolute disparity; we used 15% as it was a natural break in the data.
2.4. Supplemental Analysis
We conducted four supplemental analyses. The first replicates the analysis for a ≥75 age group. The second replicates the analysis on an additional dependent variable: the number of extreme heat days (a derivative of the number of heat waves defined as ≥2 extreme heat days). The third replicates the analysis for the more detailed, but non-mutually exclusive race and ethnicity categories (instead of the POC variable used in the main results). The fourth replicates the main analysis for each of the four US Census regions: Northeast, Midwest, South and West.
3. RESULTS
3.1. PWME for Mean Temperature
As seen in Table 2, Section A, the average daily summer temperature for people in the US (2015–2019) is 22.8 °C. While statistically significant, there were no substantial differences between the three age categories, i.e., children experienced an average temperature of 22.9 °C followed by adults and older adults at 22.7 °C. POC experience substantially higher temperatures than non-Hispanic Whites in the three age categories. These differences are 1.3 °C for children, 1.3 °C for adults, and 1.2 °C for older adults. Those without health insurance experience hotter temperatures than those with health insurance in all age groups. The magnitude of the differences based on health insurance status are consistent across the age groups, i.e., 1.2 °C to 1.3 °C difference for each age group. Persons in poverty experience hotter mean daily temperatures than those who are not poor across the three age groups, although these differences are smaller than they are for race/ethnicity and insurance status, ranging from 0.4 °C for adults to 0.7 °C for children. Differences for disability status were minimal for all ages and within each age bracket although they were still statistically significant, with the exception of children.
Table 2.
Population-weighted mean exposure to extreme heat by demographic group by age, as measured using A) daily average temperature in °C; B) number of heat waves, and C) number of heat island days.
| A) Daily average temperature in °C | B) Number of heat waves | C) Number of heat island days | ||||||||||
|---|---|---|---|---|---|---|---|---|---|---|---|---|
| All Ages | Children | Adults | ≥65 Yrs. | All Ages | Children | Adults | ≥65 Yrs. | All Ages | Children | Adults | ≥65 Yrs. | |
| PWME (SE) | PWME (SE) | PWME (SE) | PWME (SE) | PWME (SE) | PWME (SE) | PWME (SE) | PWME (SE) | PWME (SE) | PWME (SE) | PWME (SE) | PWME (SE) | |
| Total | 22.8 (0.0002) | 22.9 (0.0004) | 22.7 (0.0002) | 22.7 (0.0005) | 3.7 (0.0001) | 3.6 (0.0003) | 3.7 (0.0002) | 3.7 (0.0003) | 26.1 (0.0022) | 26.3 (0.0046) | 26.0 (0.0028) | 26.4 (0.0056) |
| RACE/ ETHNICITY | ||||||||||||
| White Alone (Not Hispanic) | 22.2 (0.0002) | 22.2 (0.0005) | 22.2 (0.0003) | 22.4 (0.0006) | 3.3 (0.0002) | 3.2 (0.0004) | 3.3 (0.0002) | 3.5 (0.0004) | 24.0 (0.0026) | 22.9 (0.0057) | 23.9 (0.0032) | 25.4 (0.0062) |
| Persons of Color | 23.5* (0.0003) | 23.5* (0.0005) | 23.5* (0.0002) | 23.6* (0.0009) | 4.3* (0.0002) | 4.2* (0.0004) | 4.4* (0.0001) | 4.6* (0.0007) | 30.0* (0.0037) | 30.4* (0.0070) | 29.8* (0.0023) | 30.2* (0.0120) |
| POVERTY | ||||||||||||
| Not in poverty | 22.7 (0.0002) | 22.8 (0.0004) | 22.7 (0.0003) | 22.6 (0.0005) | 3.7 (0.0001) | 3.6 (0.0003) | 3.7 (0.0002) | 3.7 (0.0004) | 25.8 (0.0023) | 25.7 (0.0051) | 25.8 (0.0029) | 26.2 (0.0059) |
| In poverty | 23.2* (0.0005) | 23.4* (0.0009) | 23.1* (0.0007) | 23.1* (0.0016) | 3.7* (0.0004) | 3.7* (0.0007) | 3.7 (0.0005) | 3.9* (0.0012) | 28.4* (0.0067) | 28.9* (0.0123) | 28.1* (0.0087) | 28.2* (0.0194) |
| HEALTH INSURANCE | ||||||||||||
| With health insurance | 22.6 (0.0002) | 22.8 (0.0004) | 22.6 (0.0003) | 22.7 (0.0005) | 3.7 (0.0001) | 3.6 (0.0003) | 3.7 (0.0002) | 3.7 (0.0003) | 26.0 (0.0023) | 26.2 (0.0047) | 25.8 (0.0030) | 26.4 (0.0057) |
| No health insurance | 23.9* (0.0007) | 24.0* (0.0019) | 23.9* (0.0007) | 24.0* (0.0057) | 3.8* (0.0005) | 3.6 (0.0012) | 3.8* (0.005) | 4.3* (0.0042) | 27.8* (0.0075) | 27.5* (0.0203) | 27.8* (0.0082) | 31.4* (0.0680) |
| DISABILITY | ||||||||||||
| No disability | 22.7 (0.0002) | 22.9 (0.0004) | 22.7 (0.003) | 22.6 (0.006) | 3.7 (0.0001) | 3.7 (0.0003) | 3.7 (0.0002) | 3.7 (0.0004) | 26.1 (0.0057) | 26.3 (0.0048) | 26.0 (0.0029) | 26.3 (0.0069) |
| Any disability | 22.8* (0.0005) | 22.9 (0.0020) | 22.8* (0.008) | 22.8* (0.008) | 3.6* (0.0004) | 3.5* (0.0013) | 3.5* (0.0005) | 3.7* (0.0006) | 26.2 (0.0063) | 26.2 (0.0227) | 26.0 (0.0088) | 26.6 (0.0098) |
Bonferroni adjusted p< 0.001. P-value refers to differences in PWME between groups in each category (i.e., POC vs White)
Note: PWME = Population-weighted mean exposure. SE=standard error
3.2. PWME for Heat Waves
As per Table 2, Section B, the average person in the US experienced 3.7 heat waves over the five-year period under study. When comparing between the age groups, there were no substantive differences: adults and older adults both experienced 3.7 and children experienced 3.6, on average. When examining race/ethnicity by age groupings, we found that POC children, adults, and older adults all experienced 1 to 1.1 more heat waves than their similarly aged White counterparts. There were no substantial differences in heat wave exposure for children or adults based on insurance status. However, older adults without insurance experienced 0.6 more heat waves than those with insurance. No meaningful differences were found for poverty or disability (i.e., all were below 0.1 SD or <0.24 heat waves).
3.3. PWME for Heat Island Days
As shown in Table 2, Section C, the average US resident experienced 26.1 heat island days between 2015–2019. There were very minor differences when comparing the age groups. Older adults experienced the most heat island days (26.4), followed by children (26.3) and then adults (26.0). While age alone was not associated with meaningful differences, there were differences based on the cross-classification of age with race/ethnicity and insurance status. In terms of race/ethnicity, children of color experienced 7.5 more days than non-Hispanic White children; that difference was 6.0 days for adults and 4.8 days for older adults. In terms of insurance status, older adults without health insurance vs. those with health insurance experienced 5.1 more heat island days. The differences by insurance status for children and adults were minimal (although statistically significant). We found that neither disability nor poverty status was associated in a meaningful way with the experience of heat island days for any age group, and none of the differences by disability status were statistically significant.
3.4. Absolute Disparities in PWME for Mean Temperature, Heat Waves and Heat Island Days
Figure 4 illustrates absolute disparities in heat exposure within each age/demographic group. Specifically, each bar captures an absolute disparity in PWME within a demographic group (e.g., poor vs. not poor) for an age group (e.g., children). Taller bars correspond to greater differences in exposure within demographic groups relative to the overall average population exposure. Absolute disparities based on race/ethnicity were notably high for heat waves and heat islands and much lower for mean temperature. Generally, disparities were higher for race/ethnicity relative to poverty, insurance status, or disability. For heat waves, race/ethnicity-based disparities in all age groups exceeded 15%. For heat islands, race/ethnicity-based disparities exceeded 15% for children and older adults. In no other demographic by heat metric comparison (e.g., poverty disparities in mean temperature) were there two or more age groups exceeding 15%.
Figure 4.

Absolute disparity values (unit: percent) comparing degree of inequality between highest and lowest predicted exposure groups for each of the three heat metrics by age.
Figure 4. Absolute disparity estimates comparing degree of inequality between highest and lowest predicted exposure groups for each of the three heat metrics by age.
Note: Mean=average daily temperature, Waves= Number of Heat Waves; Island=number of heat island days; RACE= race/ethnicity; INS=insurance status; POV=poverty and DIS=disability. The absolute disparity is calculated by subtracting the lowest PWME (e.g., White) from the highest PWME (e.g., POC); dividing that number by the total PWME for everyone no matter their race/ethnicity; and then multiplying by 100. As per Table 2, those groups with the highest exposures were—POC, poor, uninsured, disabled. The groups with the lowest exposure were—non-Hispanic White, not poor, insured and not disabled.
In terms of the greatest disparity by age group, for both the older age group and for the adult age group, the largest absolute disparity was based on race/ethnicity and occurs for heat waves (29.13%, 16.53%, respectively). For children, the largest disparity was also based on race/ethnicity, but it occurred for heat islands (27.84%). There were two additional absolute disparity values that were high, and both were based on insurance status. They are present for older adults with regards to heat waves (17.23%) and heat islands (19.22%).
3.5. Supplemental Analyses
As shown in Table C (Supplemental Material), including the ≥75 age group did not change general exposure trends by age. Results for ≥75 closely mirror results for ≥65 with a slight increase in exposure for all metrics. The largest absolute disparity within this age group was when looking at insurance status; the absolute disparities were 16.5% for heat waves and 17.7% for heat islands.
Table D in Supplemental Material provides results for PWME for the number of extreme heat days as opposed to the number of heat waves. The average person experienced 14.7 extreme heat days between 2015–2019 based on the 98th percentile for each tract. Results were similar when comparing heat days (Table D) and heat waves (Table 2-B) for age by race/ethnicity and age by poverty in terms of the age group most exposed. In looking at insurance status, only older adults showed substantially more exposure to heat waves (Table 2-B), however, both adults and older adults who were uninsured experienced more extreme heat days than their insured counterparts. Disability showed no major differences in exposure for heat days nor heat waves.
Table E in Supplemental Material provides results for PWME for the more detailed, but non-mutually exclusive, race and ethnicity categories. While the main analysis shows that POC experience greater heat exposure in all metrics, this analysis allows us to refine that to identify specific POC groups. For mean temperature (all ages), Black persons experience the highest average temperature (24.0 °C) followed by Hispanic persons (23.9 °C) and both values exceed the POC average and are 1.7 °C higher than Whites. In terms of race/ethnicity by age, older Hispanic adults have the highest mean temperature (24.3 °C). For heat waves (all ages), those of “some other race” experience the greatest number of heat waves (4.9) followed closely by Hispanic and Pacific Islander Americans (both 4.8); these values are 1.4–1.5 higher than Whites. When looking by age, older Hispanic adults have the greatest exposure (5.4 waves), which exceeds the POC average for older adults of 4.6. Hispanic older adults experienced approximately two more heat waves than older Whites. For heat island days (all ages), Pacific Islander (37.9) and Hispanic Americans (36.4) experience the greatest numbers of days; those values exceed the POC average and the White average, which is 24 days. By age, Hispanic older adults (40.3) and Pacific Islander children have the greatest values (39.7), both exceed the POC average for those age groups (both 30.2). In all age groups, Hispanics, Indigenous, Pacific Islander, and “some other race” persons had substantially more heat island exposure (i.e., ≥3.98 days) than non-Hispanic Whites. Black persons experienced fewer days than White persons in all age groups, but not substantially (<3.98).
Table F reports results for race/ethnicity-based absolute disparities. Disparities for older adults vis-à-vis adults and children are more pronounced when disaggregating the racial and ethnic groups than when lumping them all into one POC category.
Table G shows descriptive statistics for the temperature variables by region (including the .1 standard deviation cut-off for identifying substantive findings). Tables H–K show PWME results for the four Census regions. Table L reports absolute disparities for the regional analyses. There are more substantive differences between groups in the Southern and Western regions, with far fewer in the Midwest and Northeast. While no one group was at-risk to the same heat metric in all regions, there are some patterns. Both older POC and older individuals without insurance had disproportionate exposure to at least one heat metric in all four regions. The results for “total”, which capture all persons in the region, highlight the regional differences in the heat metrics, with the West having the highest average numbers of heat waves and heat islands and the Midwest having the lowest.
4. DISCUSSION
When looking at age alone, we found that the three age groups experienced similar mean temperatures (range of 0.2 °C), number of heat waves (range of <0.1) and numbers of heat island days (range of 0.4 days). Other studies in specific places using LST have found age-based differences showing children, but not older adults, to be more exposed (Mitchell & Chakraborty, 2015; Renteria et al., 2022; Voelkel et al., 2018). When looking at the whole contiguous United States, we do not see substantive differences by age. Children experience slightly higher temperatures than adults and older adults, and older adults experience more heat waves and heat island days than the other age groups, but these differences are small. More substantive disparities occur when sociodemographic categories are examined by age group.
When comparing race/ethnicity by age, all age groups experience substantial differences in exposure by race/ethnicity. Children of color experienced 1.3 °C higher temperatures, 1 more heat wave and 7.5 more heat island days than White children. Children had the highest race/ethnicity-based absolute disparities for heat islands and mean temperature as compared to the two other age groups. Older adults of color also experience hotter temperatures (1.2 °C), 1.1 more heat wave and 4.8 more heat island days than White older adults. Older adults also have the highest race/ethnicity-based absolute disparity for heat waves. Race/ethnicity-based disparities in heat were also substantial for adults of color vs. White adults (1.3 °C, 1.0 heat waves and 6.0 more heat island days). When pooling all ages together, people of color experience increased heat exposure for all three metrics (i.e., all show more than .1 SD increase compared to White persons) and the absolute disparities are among the highest in the study for heat waves (26.7%) and heat islands (22.7%), while they are lower for mean temperature (5.6%). While our analysis lumped all POC together, previous studies have identified that Hispanic and Black individuals are more exposed to extreme temperatures (Renteria et al., 2022), heat waves (Rastogi et al., 2023), and urban heat islands (Chakraborty et al., 2019; Mitchell & Chakraborty, 2014; Voelkel et al., 2018). The legacies of historical redlining have led many POC to reside in hotter areas. This has specifically been shown to be the case in Baltimore, Dallas and Kansas City, where areas that were historically redlined still have larger racial and ethnic minority populations as well as warmer temperatures (Wilson, 2020).
Interestingly, there were meaningful differences in exposure based on poverty status for mean temperature for all age groups combined, but not for heat waves or heat islands (based on differences exceeding 0.1 SD). Those in poverty tend to lack access to health-promoting resources (Gronlund, 2014; Jessel et al., 2019), making them vulnerable to high temperatures. For instance, during the Chicago heat wave in 1995, older adults in poverty were especially vulnerable to heat (Klinenberg, 2015). Other studies have found lower incomes associated with high land surface temperature in census tracts (Benz & Burney, 2021) as we did here. Unlike this study, others have linked lower income with urban heat islands in various cities (Chakraborty et al., 2019; Hsu et al., 2021). While our national pattern runs counter to these other studies, the regional analysis reveals associations between poverty and both heat waves and heat islands in the North and Northwest regions. The differences in exposure based on the three heat metrics demonstrates a contrasting pattern with respect to poverty, reinforcing the importance of using multiple measures of heat to assess risk.
Older adults without insurance emerged as a risk group experiencing 1.3 °C higher temperatures, 0.6 more heat waves, and over 5 more heat island days than older adults with insurance. The insurance-based absolute disparity for heat islands was much larger within the older adult group than other groups (e.g., it was 14% higher than the lowest absolute disparity group), further highlighting their risk. This same insurance-based risk differential does not exist for children as uninsured and insured children have roughly the same number of heat waves and heat island days on average, although mean temperatures are 1.2 degrees hotter for uninsured relative to insured children. Only 0.8% of those 65 and older do not have insurance as Medicare gives most older adults insurance coverage. Studies looking at this small population have shown them to be disproportionately non-White, foreign-born, and living in poverty (Mold et al., 2004).
The disproportionate exposure for older adults of color (temperature, heat waves, heat islands) and older adults that are uninsured (temperature, heat waves, heat islands) illustrates a constellation of factors that shape heat-related risks. These individuals are likely to be socially vulnerable to heat due to their societal position and resource levels (Cobian et al., 2020; Huguet et al., 2023; Mold et al., 2004). Older adults of color may also be inclined to dwell in urban areas. Legacies of historical redlining policies have contributed to disadvantages among older adults of color, limiting their residential options, particularly in urban settings (Egede et al., 2023). Older adults without insurance are a group that disproportionately consists of non-US citizens (Ayon et al., 2020; Ro et al. 2021). These individuals have higher rates of preventable chronic health conditions and are more vulnerable to negative health outcomes due to lower eligibility for social welfare, language and cultural barriers, and financial barriers (Balakrishnan & Jordan, 2019; Galvan et al., 2021). These disproportionate health risks for uninsured older adults are significant given this group may be delayed in seeking health care for heat-related illness as they use health care less than those with insurance (Benmarhnia et al., 2015) and have limited access to preventive care (Choi et al., 2020; Li et al., 2021). They also often have a greater number of undiagnosed health conditions that may make them more vulnerable to the impacts of heat (Huguet et al., 2023). Older adults within these socially vulnerable groups may also face financial constraints and lack motivation to relocate to another residential area (Lofqvist et al., 2013). The desire to maintain established social networks also contributes to their residential preferences (Rook, 2009). These factors may contribute to heat risks for these groups of older adults.
There were no substantial differences in heat risk when looking at disability status. There were few differences between the age groups and only small absolute disparities in each age group. The lack of differences was mirrored in each age group. These results add to a small and mixed group of studies on heat exposure of populations with disabilities, some of which show increased heat exposure for those with disabilities (Mitchell & Chakraborty, 2015) although others do not (Renteria et al., 2022). As this population is more vulnerable (Bouchama et al., 2007; Cheshire, 2016; Kosanic et al., 2022), and few studies have been conducted looking at exposure for individuals with disabilities, more studies need to be done to validate our results.
Including three heat metrics allowed us to illuminate groups that were consistently at higher risk (e.g., persons of color of all ages) and groups which experienced heightened exposure to specific metrics (e.g. children in poverty for temperature but not heat waves or heat islands). Of the three-heat metrics, we see the greatest absolute disparities for heat islands and heat waves, specifically for race/ethnicity (all age groups) and insurance status (older adults). Heat islands capture the exposure of populations in a neighborhood in comparison to the surrounding county populations. Heat islands are associated with built environmental features (e.g., high impervious surface cover and low canopy cover) (Mitchell & Chakraborty, 2015), which are more common in spaces where POC and other less privileged people live (e.g., older adults without health insurance). Heat islands occur in areas with fewer trees and more industrial land uses as these areas tend to capture more heat (Mitchell & Chakraborty, 2015). Unlike heat islands, heat waves impact larger regions. Daily average temperature varies less year to year than the other metrics and it captures regional differences in climate and weather. The absolute disparity for mean temperature tended to be lower than for heat islands and heat waves, likely since social groups are more evenly distributed among the regional-scale gradients in this metric. The differences in what each metrics captures make it important to include them in the same analysis.
4.1. Limitations
While PRISM heat data have been widely used (Bernstein et al., 2022; Spangler et al., 2019; Weinberger et al., 2019; Williams et al., 2020), estimates are model based, meaning that values used are not generally actual recorded temperature values. PRISM is also a gridded dataset, and though it is high resolution compared to other climatic datasets, microclimates may exist within grid cells.
In terms of our heat metrics, we did not consider nighttime temperature relief or humidity, both of which are included in some other studies (Chakraborty et al., 2023; Deng et al., 2018; Wehner et al., 2017). Yet, the heat measures we included have been associated with health effects in other studies (e.g., Kent et al., 2014). Future research on heat disparities should consider assessing nighttime temperature or a heat index (combining heat and humidity). This study did not consider indoor air temperature even though the majority of fatal heat exposures occur indoors (Deng et al., 2018). While individuals spend a vast majority of their time indoors, many individuals work or recreate outdoors. Depending on the conditions and the person, heat exhaustion and heat stroke can set in within 10–15 minutes of outdoor exposure; it can also develop over several hours or days (NHS 2024). Outdoor temperatures are also important from an equity standpoint. When people do not have air conditioning at their home (or do not have the financial resources to run their AC at full capacity), hotter outdoor temperatures make indoor temperatures hotter and potentially unsafe. Racial/ethnic minority groups, renters, and persons of low socioeconomic status are less likely to have air conditioning (Ahn and Uejio 2022; Davis et al 2021; Romitti et al., 2022).
In terms of the socio-demographic data, we are limited by which variables the ACS releases by age at the census tract level. While ACS provides race and ethnicity by age, in order to create mutually exclusive categories for our analysis, we had to lump all persons of color into the same group. This is a limitation as it masks important differences in history and identity. Additionally, we lump together all disabilities and simply measure if someone has at least one disability. As disability status is a broad category, future research could disaggregate heat exposure among specific disability categories (e.g., mobility disabilities may have different heat exposure than cognitive disabilities). While it is a small difference, not all demographics had the same age categories. Insurance status for adults included ages 19–64 while the other adult categories included 18–64. English language proficiency, foreign-nativity, and citizenship are other important variables in terms of identifying groups that might be at-risk during heat events, but those variables are not available by age and so we could not examine them here. While the US national scope of the study is a strength, findings at a national scale may not hold for individual regions (Hsu et al., 2021; Ragettli et al., 2017).
5. CONCLUSIONS
The intersectional approach that we used highlighted disproportionate exposures to heat for select demographic groups and illuminated which intersectional identities experienced the greatest exposure. We found children of color, older adults of color, and uninsured older adults to be particularly exposed. Our usage of various heat metrics also identified populations at-risk to multiple dimensions of heat (e.g., POC), as well as those whose risk profile is more varied (e.g., children).
Showing which subpopulations experience disproportionate exposure to various heat events can inform programs and policies aimed at mitigating the impact of heat among the most exposed populations. From an urban planning perspective, city planners can adopt nature-based cooling solutions to reduce temperature in areas with a higher concentration of exposed populations. These solutions may include optimizing tree canopy coverage and increasing vegetation density. At the local level, it is crucial for policymakers to optimize local assistance programs aimed at supporting and minimizing heat risks for socially marginalized children and older adults during EHE. This may involve providing free air conditioners, subsidizing energy costs, and opening community cooling centers. Community outreach to vulnerable groups is also essential to ensuring they are protected when heat events strike. For instance, social workers can conduct thorough assessments of uninsured older adults which are likely at great medical risk and address their needs during heat events, such as enhancing access to fans and air-conditioning. Regular home visits to check on the most vulnerable is also needed. In addition, health education programs and public health messages focused on the importance of staying hydrated and indoors during extreme heat events could help people stay safe during heat events. While extreme heat can lead to morbidity and mortality impacts on anyone, working to protect the most exposed populations will help to narrow the disparities in climate change impacts.
Supplementary Material
Highlights:
Sociodemographic inequalities in heat exposure exist within each age group.
Older adults of color experienced 1.1 more heat waves than White older adults.
Uninsured older adults experienced 5.1 more heat island days than insured older adults.
Children of color experienced 7.5 more heat island days than White children.
Adults of color experienced 6.0 more heat island days than White adults.
Acknowledgements:
We recognize our research team which includes Ming Wen, Dennis Wei, Yue Zhang, and Ben Cheung for their support of this paper.
Funding:
This work was supported by the National Institute on Aging of the National Institutes of Health under award R01AG080440. The content is solely the responsibility of the authors and does not necessarily represent the official views of the National Institutes of Health.
Footnotes
Credit authorship contribution statement: Austin Clark: Formal analysis, Investigation, Data Curation, Writing - Original Draft, Writing - Review & Editing, Visualization. Sara Grineski: Conceptualization, Methodology, Formal analysis, Writing - Original Draft, Writing - Review & Editing, Supervision, Funding acquisition. David Curtis: Writing - Review & Editing, Project administration, Funding acquisition. Ethan Cheung: Writing - Review & Editing
Data Statement:
American Community Survey data are available for public download (https://data.census.gov/). PRISM data can be purchased from the Prism Climate Group at Oregon State University.
REFERENCES
- Armstrong B, Sera F, Vicedo-Cabrera AM, Abrutzky R, Åström DO, Bell ML, et al. 2019. The role of humidity in associations of high temperature with mortality: a multicountry, multicity study. Environ Health Perspect 127(9):97007, 10.1289/EHP5430 [DOI] [PMC free article] [PubMed] [Google Scholar]
- Ahn Y, & Uejio CK (2022). Modeling air conditioning ownership and availability. Urban Climate, 46, 101322. [Google Scholar]
- Ayón C, Ramos Santiago J, & López Torres AS (2020). Latinx undocumented older adults, health needs and access to healthcare. Journal of Immigrant and Minority Health, 22, 996–1009. [DOI] [PubMed] [Google Scholar]
- Balakrishnan A, & Jordan N (2019). The Undocumented Elderly: Coverage Gaps and Low Health Care Use. Journal of Health Care for the Poor and Underserved, 30(3), 891–898. 10.1353/hpu.2019.0062 [DOI] [PMC free article] [PubMed] [Google Scholar]
- Baldwin JW, Benmarhnia T, Ebi KL, Jay O, Lutsko NJ, Vanos JK. Humidity’s Role in Heat-Related Health Outcomes: A Heated Debate. Environ Health Perspect. 2023. May;131(5):55001. doi: 10.1289/EHP11807 [DOI] [PMC free article] [PubMed] [Google Scholar]
- Bauer GR, Churchill SM, Mahendran M, Walwyn C, Lizotte D, & Villa-Rueda AA (2021). Intersectionality in quantitative research: A systematic review of its emergence and applications of theory and methods. SSM - Population Health, 14. 10.1016/j.ssmph.2021.100798 [DOI] [PMC free article] [PubMed] [Google Scholar]
- Bauer GR, & Scheim AI (2019). Advancing quantitative intersectionality research methods: Intracategorical and intercategorical approaches to shared and differential constructs. In Social Science and Medicine (Vol. 226, pp. 260–262). Elsevier Ltd. 10.1016/j.socscimed.2019.03.018 [DOI] [PubMed] [Google Scholar]
- Benmarhnia T, Deguen S, Kaufman JS, & Smargiassi A (2015). Vulnerability to Heat-related Mortality. Source: Epidemiology, 26(6), 781–793. 10.2307/26511729 [DOI] [PubMed] [Google Scholar]
- Benz SA, & Burney JA (2021). Widespread Race and Class Disparities in Surface Urban Heat Extremes Across the United States. Earth’s Future, 9(7). 10.1029/2021EF002016 [DOI] [Google Scholar]
- Berberian AG, Gonzalez DJX, & Cushing LJ (2022). Racial Disparities in Climate Change-Related Health Effects in the United States. In Current Environmental Health Reports (Vol. 9, Issue 3, pp. 451–464). Springer Science and Business Media Deutschland GmbH. 10.1007/s40572-022-00360-w [DOI] [PMC free article] [PubMed] [Google Scholar]
- Bernstein AS, Sun S, Weinberger KR, Spangler KR, Sheffield PE, & Wellenius GA (2022). Warm Season and Emergency Department Visits to U.S. Children’s Hospitals. Environmental Health Perspectives, 130(1). 10.1289/ehp8083 [DOI] [PMC free article] [PubMed] [Google Scholar]
- Blaikie P, Cannon T, Davis I, & Wisner B (2014). At Risk. Routledge. 10.4324/9780203714775 [DOI] [Google Scholar]
- Bouchama A, Dehbi M, Mohamed G, Matthies F, Shoukri M, & Menne B (2007). Prognostic Factors in Heat Wave-Related Deaths A Meta-analysis. 10.1001/archinte.167.20.ira70009 [DOI] [PubMed] [Google Scholar]
- Carr D, Falchetta G, & Sue Wing I (2024). Population aging and heat exposure in the 21st century: Which US regions are at greatest risk and why?. The Gerontologist, 64(3), gnad050. [DOI] [PMC free article] [PubMed] [Google Scholar]
- Chakraborty T, Hsu A, Manya D, & Sheriff G (2019). Disproportionately higher exposure to urban heat in lower-income neighborhoods: A multi-city perspective. In Environmental Research Letters (Vol. 14, Issue 10). Institute of Physics Publishing. 10.1088/1748-9326/ab3b99 [DOI] [Google Scholar]
- Chakraborty TC, Newman AJ, Qian Y, Hsu A, & Sheriff G (2023). Residential segregation and outdoor urban moist heat stress disparities in the United States. One Earth, 6(6), 738–750. [Google Scholar]
- Chen SY, Feng Z, & Yi X (2017). A general introduction to adjustment for multiple comparisons. Journal of thoracic disease, 9(6), 1725. [DOI] [PMC free article] [PubMed] [Google Scholar]
- Cheshire WP (2016). Thermoregulatory disorders and illness related to heat and cold stress. In Autonomic Neuroscience: Basic and Clinical (Vol. 196, pp. 91–104). Elsevier B.V. 10.1016/j.autneu.2016.01.001 [DOI] [PubMed] [Google Scholar]
- Chong TWH, & Castle DJ (2004). Layer upon layer: Thermoregulation in schizophrenia. Schizophrenia Research, 69(2–3), 149–157. 10.1016/S0920-9964(03)00222-6 [DOI] [PubMed] [Google Scholar]
- Choi NG, DiNitto DM, & Choi BY (2020). Unmet healthcare needs and healthcare access gaps among uninsured US adults aged 50–64. International journal of environmental research and public health, 17(8), 2711. [DOI] [PMC free article] [PubMed] [Google Scholar]
- Christenson M, Geiger SD, Phillips J, Anderson B, Losurdo G, & Anderson HA (2017). Heat Vulnerability Index Mapping for Milwaukee and Wisconsin. 23(4), 396–403. 10.2307/48517290 [DOI] [PubMed] [Google Scholar]
- Cobian J, González MG, Cao YJ, Xu H, Li R, Mendis M, Noyes K, & Becerra AZ (2020). Changes in Health Insurance Coverage Over Time by Immigration Status Among US Older Adults, 1992–2016. JAMA Network Open, 3(3), e200731. 10.1001/jamanetworkopen.2020.0731 [DOI] [PMC free article] [PubMed] [Google Scholar]
- Collins TW, & Grineski SE (2022). Racial/Ethnic Disparities in Short-Term PM2:5 Air Pollution Exposures in the United States. In Environmental Health Perspectives (Vol. 130, Issue 8, pp. 087701-1-087701-087704). Public Health Services, US Dept of Health and Human Services. 10.1289/EHP11479 [DOI] [PMC free article] [PubMed] [Google Scholar]
- Daly C, Gibson W, Taylor G, Johnson G, & Pasteris P (2002). A knowledge-based approach to the statistical mapping of climate. 10.3354/cr022099 [DOI] [Google Scholar]
- Daly C & National Center for Atmospheric Research Staff (2023). “The Climate Data Guide: PRISM High-Resolution Spatial Climate Data for the United States: Max/min temp, dewpoint, precipitation.” https://climatedataguide.ucar.edu/climate-data/prism-high-resolution-spatial-climate-data-united-states-maxmin-temp-dewpoint
- Daly C, Smith JW, Smith JI, & McKane RB (2007). High-resolution spatial modeling of daily weather elements for a catchment in the Oregon Cascade Mountains, United States. Journal of Applied Meteorology and Climatology, 46(10), 1565–1586. 10.1175/JAM2548.1 [DOI] [Google Scholar]
- Davis L, Gertler P, Jarvis S, & Wolfram C (2021). Air conditioning and global inequality. Global Environmental Change, 69, 102299. [Google Scholar]
- Debbage N, & Shepherd JM (2015). The urban heat island effect and city contiguity. Computers, Environment and Urban Systems, 54, 181–194. [Google Scholar]
- Deng Q, Zhao J, Liu W, & Li Y (2018). Heatstroke at home: Prediction by thermoregulation modeling. Building and Environment, 137, 147–156. [Google Scholar]
- Egede LE, Walker RJ, Campbell JA, Linde S, Hawks LC, & Burgess KM (2023). Modern Day Consequences of Historic Redlining: Finding a Path Forward. Journal of General Internal Medicine, 38(6), 1534–1537. 10.1007/s11606-023-08051-4 [DOI] [PMC free article] [PubMed] [Google Scholar]
- Falchetta G, De Cian E, Sue Wing I, & Carr D (2024). Global projections of heat exposure of older adults. Nature Communications, 15(1), 3678. [DOI] [PMC free article] [PubMed] [Google Scholar]
- Figgs LW (2019). Emergency department asthma diagnosis risk associated with the 2012 heat wave and drought in Douglas County NE, USA. Heart and Lung, 48(3), 250–257. 10.1016/j.hrtlng.2018.12.005 [DOI] [PubMed] [Google Scholar]
- Fischer EM, Sippel S, & Knutti R (2021). Increasing probability of record-shattering climate extremes. Nature Climate Change, 11(8), 689–695. 10.1038/s41558-021-01092-9 [DOI] [Google Scholar]
- Fisher JA, Jiang C, Soneja SI, Mitchell C, Puett RC, & Sapkota A (2017). Summertime extreme heat events and increased risk of acute myocardial infarction hospitalizations. Journal of Exposure Science & Environmental Epidemiology, 27(3), 276–280. 10.1038/jes.2016.83 [DOI] [PubMed] [Google Scholar]
- Galvan T, Lill S, & Garcini LM (2021). Another Brick in the Wall: Healthcare Access Difficulties and Their Implications for Undocumented Latino/a Immigrants. Journal of Immigrant and Minority Health, 23(5), 885–894. 10.1007/s10903-021-01187-7 [DOI] [PMC free article] [PubMed] [Google Scholar]
- Grineski S, Scott M, Collins T, Chakraborty J, & Ramos K (2023). Anxiety and depression after winter storm Uri: Cascading disasters and mental health inequities. International Journal of Disaster Risk Reduction, 96. 10.1016/j.ijdrr.2023.103933 [DOI] [Google Scholar]
- Gronlund CJ (2014). Racial and Socioeconomic Disparities in Heat-Related Health Effects and Their Mechanisms: a Review. Current Epidemiology Reports, 1(3), 165–173. 10.1007/s40471-014-0014-4 [DOI] [PMC free article] [PubMed] [Google Scholar]
- Gustafsson PE, Fonseca-Rodríguez O, Nilsson I, & San Sebastián M (2022). Intersectional inequalities in loneliness among older adults before and during the early phase of the COVID-19 pandemic: A total population survey in the Swedish eldercare setting. Social Science and Medicine, 314. 10.1016/j.socscimed.2022.115447 [DOI] [PMC free article] [PubMed] [Google Scholar]
- Ha S, Nguyen K, Liu D, Männistö T, Nobles C, Sherman S, & Mendola P (2017). Ambient temperature and risk of cardiovascular events at labor and delivery: A case-crossover study. Environmental Research, 159, 622–628. 10.1016/j.envres.2017.09.010 [DOI] [PMC free article] [PubMed] [Google Scholar]
- Henderson SB, McLean KE, Lee MJ, & Kosatsky T (2022). Analysis of community deaths during the catastrophic 2021 heat dome: Early evidence to inform the public health response during subsequent events in greater Vancouver, Canada. Environmental Epidemiology, 6(1), e189. [DOI] [PMC free article] [PubMed] [Google Scholar]
- Hsu A, Sheriff G, Chakraborty T, & Manya D (2021). Disproportionate exposure to urban heat island intensity across major US cities. Nature Communications, 12(1). 10.1038/s41467-021-22799-5 [DOI] [PMC free article] [PubMed] [Google Scholar]
- Huguet N, Hodes T, Liu S, Marino M, Schmidt TD, Voss RW, Peak KD, & Quiñones AR (2023). Impact of Health Insurance Patterns on Chronic Health Conditions Among Older Patients. Journal of the American Board of Family Medicine, 36(5), 839–850. 10.3122/jabfm.2023.230106R1 [DOI] [PMC free article] [PubMed] [Google Scholar]
- Jessel S, Sawyer S, & Hernández D (2019). Energy, Poverty, and Health in Climate Change: A Comprehensive Review of an Emerging Literature. In Frontiers in Public Health (Vol. 7). Frontiers Media S.A. 10.3389/fpubh.2019.00357 [DOI] [PMC free article] [PubMed] [Google Scholar]
- Kent ST, McClure LA, Zaitchik BF, Smith TT, & Gohlke JM (2014). Heat waves and health outcomes in Alabama (USA): The importance of heat wave definition. Environmental Health Perspectives, 122(2), 151–158. 10.1289/ehp.1307262 [DOI] [PMC free article] [PubMed] [Google Scholar]
- Klinenberg E (2015). Heat Wave A Social Autopsy of Disaster in Chicago. University of Chicago press. [DOI] [PubMed] [Google Scholar]
- Kohon JN, Tanaka K, Himes D, Toda E, Carder PC, & Carlson B (2024). Extreme heat vulnerability among older adults: A multilevel risk index for Portland, Oregon. The Gerontologist, 64(3), gnad074. [DOI] [PubMed] [Google Scholar]
- Kosanic A, Petzold J, Martín-López B, & Razanajatovo M (2022). An inclusive future: disabled populations in the context of climate and environmental change. In Current Opinion in Environmental Sustainability (Vol. 55). Elsevier B.V. 10.1016/j.cosust.2022.101159 [DOI] [Google Scholar]
- Li Y, Toseef MU, Jensen GA, Ortiz K, González HM, & Tarraf W (2021). Gains in insurance coverage following the affordable care act and change in preventive services use among non-elderly US immigrants. Preventive Medicine, 148, 106546. [DOI] [PubMed] [Google Scholar]
- Liu J, Clark LP, Bechle MJ, Hajat A, Kim SY, Robinson AL, Sheppard L, Szpiro AA, & Marshall JD (2021). Disparities in Air Pollution Exposure in the United States by Race/Ethnicity and Income, 1990–2010. Environmental Health Perspectives, 129(12). 10.1289/EHP8584 [DOI] [PMC free article] [PubMed] [Google Scholar]
- Liu Y, Zhong L, Puram SV, & Mazul AL (2023). Neighborhood Socioeconomic Status and Racial and Ethnic Survival Disparities in Oral Cavity and Laryngeal Cancer. Cancer Epidemiology, Biomarkers & Prevention, 32(5), 642–652. 10.1158/1055-9965.EPI-22-0963 [DOI] [PMC free article] [PubMed] [Google Scholar]
- Lofqvist C, Granbom M, Himmelsbach I, Iwarsson S, Oswald F, & Haak M (2013). Voices on Relocation and Aging in Place in Very Old Age--A Complex and Ambivalent Matter. The Gerontologist, 53(6), 919–927. 10.1093/geront/gnt034 [DOI] [PubMed] [Google Scholar]
- Madrigano J, Mittleman MA, Baccarelli A, Goldberg R, Melly S, Von Klot S, & Schwartz J (2013). Temperature, myocardial infarction, and mortality: Effect modification by individual-and area-level characteristics. Epidemiology, 24(3), 439–446. 10.1097/EDE.0b013e3182878397 [DOI] [PMC free article] [PubMed] [Google Scholar]
- Marx W, Haunschild R, & Bornmann L (2021). Heat waves: a hot topic in climate change research. Theoretical and Applied Climatology, 146(1–2), 781–800. 10.1007/s00704-021-03758-y [DOI] [PMC free article] [PubMed] [Google Scholar]
- Meade RD, Akerman AP, Notley SR, McGinn R, Poirier P, Gosselin P, & Kenny GP (2020). Physiological factors characterizing heat-vulnerable older adults: A narrative review. In Environment International (Vol. 144). Elsevier Ltd. 10.1016/j.envint.2020.105909 [DOI] [PubMed] [Google Scholar]
- Mena E, & Bolte G (2019). Intersectionality-based quantitative health research and sex/gender sensitivity: A scoping review. In International Journal for Equity in Health (Vol. 18, Issue 1). BioMed Central Ltd. 10.1186/s12939-019-1098-8 [DOI] [PMC free article] [PubMed] [Google Scholar]
- Méndez-Lázaro P, Muller-Karger FE, Otis D, McCarthy MJ, & Rodríguez E (2018). A heat vulnerability index to improve urban public health management in San Juan, Puerto Rico. International Journal of Biometeorology, 62(5), 709–722. 10.1007/s00484-017-1319-z [DOI] [PubMed] [Google Scholar]
- Mitchell BC, & Chakraborty J (2014). Urban Heat and Climate Justice: A Landscape of Thermal Inequity in Pinellas County, Florida. Geographical Review, 104(4), 459–480. 10.1111/j.1931-0846.2014.12039.x [DOI] [Google Scholar]
- Mitchell BC, & Chakraborty J (2015). Landscapes of thermal inequity: Disproportionate exposure to urban heat in the three largest US cities. Environmental Research Letters, 10(11). 10.1088/1748-9326/10/11/115005 [DOI] [Google Scholar]
- Mold JW, Fryer GE, & Thomas CH (2004). Who Are the Uninsured Elderly in the United States? Journal of the American Geriatrics Society, 52(4), 601–606. 10.1111/j.1532-5415.2004.52169.x [DOI] [PubMed] [Google Scholar]
- Morello-Frosch R, Zuk M, Jerrett M, Shamasunder B, & Kyle AD. “Understanding the cumulative impacts of inequalities in environmental health: implications for policy.” Health affairs 30, no. 5 (2011): 879–887. [DOI] [PubMed] [Google Scholar]
- Mutiibwa D, Strachan S, & Albright T (2015). Land Surface Temperature and Surface Air Temperature in Complex Terrain. IEEE Journal of Selected Topics in Applied Earth Observations and Remote Sensing, 8(10), 4762–4774. 10.1109/JSTARS.2015.2468594 [DOI] [Google Scholar]
- National Weather Services. (2022). Weather Related Fatality and Injury Statistics.
- NHS (National Health Service, UK). 2024. Heat exhaustion and heatstroke Available from: https://www.nidirect.gov.uk/conditions/heat-exhaustion-and-heatstroke#:~:text=Heat%20exhaustion%20or%20heatstroke%20can,feeling%20faint%20or%20dizzy
- NOAA National Centers for Environmental Information. (2023). Monthly Global Climate Report for Annual 2022.
- Ou Y, Wang F, Zhao J, & Deng Q (2023). Risk of heatstroke in healthy elderly during heatwaves: a thermoregulatory modeling study. Building and Environment, 237, 110324. [Google Scholar]
- Perkins-Kirkpatrick SE, & Lewis SC (2020). Increasing trends in regional heatwaves. Nature Communications, 11(1). 10.1038/s41467-020-16970-7 [DOI] [PMC free article] [PubMed] [Google Scholar]
- Philip S, Kew S, Vautard R, Pinto I, Vahlberg M, Singh R, Driouech F, Lguensat R, Barnes C, & Otto F (2023). Extreme April heat in Spain, Portugal, Morocco & Algeria almost impossible without climate change. 10.25561/103833 [DOI] [Google Scholar]
- Philip SY, Kew SF, Van Oldenborgh GJ, Anslow FS, Seneviratne SI, Vautard R, Coumou D, Ebi KL, Arrighi J, Singh R, Van Aalst M, Pereira Marghidan C, Wehner M, Yang W, Li S, Schumacher DL, Hauser M, Bonnet R, Luu LN, … Otto FEL (2022). Rapid attribution analysis of the extraordinary heat wave on the Pacific coast of the US and Canada in June 2021. Earth System Dynamics, 13(4), 1689–1713. 10.5194/esd-13-1689-2022 [DOI] [Google Scholar]
- PRISM Climate Group, Oregon State University, https://prism.oregonstate.edu, data created 7 April 2023, accessed 7 April 2023. (n.d.).
- Ragettli MS, Vicedo-Cabrera AM, Schindler C, & Röösli M (2017). Exploring the association between heat and mortality in Switzerland between 1995 and 2013. Environmental Research, 158, 703–709. 10.1016/j.envres.2017.07.021 [DOI] [PubMed] [Google Scholar]
- Rastogi D, Christian J, Tuccillo J, Christian B, Kapadia AJ, & Hanson HA (2023). Exploring the Spatial Patterning of Sociodemographic Disparities in Extreme Heat Exposure at Multiple Scales Across the Conterminous United States. GeoHealth, 7(10). 10.1029/2023GH000864 [DOI] [PMC free article] [PubMed] [Google Scholar]
- Renteria R, Grineski S, Collins T, Flores A, & Trego S (2022). Social disparities in neighborhood heat in the Northeast United States. Environmental Research, 203. 10.1016/j.envres.2021.111805 [DOI] [PubMed] [Google Scholar]
- Ro A, Van Hook J, & Walsemann KM (2022). Undocumented older Latino immigrants in the United States: Population projections and share of older undocumented Latinos by health insurance coverage and chronic health conditions, 2018–2038. The Journals of Gerontology: Series B, 77(2), 389–395. [DOI] [PubMed] [Google Scholar]
- Romitti Y, Sue Wing I, Spangler KR, & Wellenius GA (2022). Inequality in the availability of residential air conditioning across 115 US metropolitan areas. PNAS nexus, 1(4), pgac210. [DOI] [PMC free article] [PubMed] [Google Scholar]
- Sarangi Chandan, et al. “Urbanization amplifies nighttime heat stress on warmer days over the US.” Geophysical Research Letters 48.24 (2021): e2021GL095678. [Google Scholar]
- Sheffield PE, Herrera MT, Kinnee EJ, & Clougherty JE (2018). Not so little differences: variation in hot weather risk to young children in New York City. Public Health, 161, 119–126. 10.1016/j.puhe.2018.06.004 [DOI] [PMC free article] [PubMed] [Google Scholar]
- Spangler KR, Weinberger KR, & Wellenius GA (2019). Suitability of gridded climate datasets for use in environmental epidemiology. Journal of Exposure Science and Environmental Epidemiology, 29(6), 777–789. 10.1038/s41370-018-0105-2 [DOI] [PMC free article] [PubMed] [Google Scholar]
- Stanberry LR, Thomson MC, & James W (2018). Prioritizing the needs of children in a changing climate. PLOS Medicine, 15(7), e1002627. 10.1371/journal.pmed.1002627 [DOI] [PMC free article] [PubMed] [Google Scholar]
- Strachan S, & Daly C (2017). Testing the daily PRISM air temperature model on semiarid mountain slopes. Journal of Geophysical Research, 122(11), 5697–5715. 10.1002/2016JD025920 [DOI] [Google Scholar]
- Thornton PE, Shrestha R, Thornton M, Kao S-C, Wei Y, and Wilson BE. 2021. Gridded daily weather data for North America with comprehensive uncertainty quantification. Scientific Data 8. 10.1038/s41597-021-00973-0 [DOI] [PMC free article] [PubMed] [Google Scholar]
- U.S. Census Bureau. (2022). American Community Survey and Puerto Rico Community Survey Design and Methodology. https://www.census.gov/programs-surveys/acs/methodology/design-and-methodology/_jcr_content/root/responsivegrid/responsivegrid/responsivegrid_429175654/imagecore.coreimg.jpeg/1670358836351/design-methodology-report-2022.jpeg
- Voelkel J, Hellman D, Sakuma R, & Shandas V (2018). Assessing Vulnerability to Urban Heat: A Study of Disproportionate Heat Exposure and Access to Refuge by Socio-Demographic Status in Portland, Oregon. International Journal of Environmental Research and Public Health, 15(4), 640. 10.3390/ijerph15040640 [DOI] [PMC free article] [PubMed] [Google Scholar]
- Wehner M, Castillo F, & Stone D (2017). The Impact of Moisture and Temperature on Human Health in Heat Waves. In Oxford Research Encyclopedia of Natural Hazard Science. Oxford University Press. 10.1093/acrefore/9780199389407.013.58 [DOI] [Google Scholar]
- Weilnhammer V, Schmid J, Mittermeier I, Schreiber F, Jiang L, Pastuhovic V, Herr C, & Heinze S (2021). Extreme weather events in europe and their health consequences – A systematic review. In International Journal of Hygiene and Environmental Health (Vol. 233). Elsevier GmbH. 10.1016/j.ijheh.2021.113688 [DOI] [PubMed] [Google Scholar]
- Weinberger KR, Spangler KR, Zanobetti A, Schwartz JD, & Wellenius GA (2019). Comparison of temperature-mortality associations estimated with different exposure metrics. Environmental Epidemiology, 3(5). 10.1097/EE9.0000000000000072 [DOI] [PMC free article] [PubMed] [Google Scholar]
- Williams AA, Allen JG, Catalano PJ, & Spengler JD (2020). The role of individual and small-area social and environmental factors on heat vulnerability to mortality within and outside of the Home in Boston, MA. Climate, 8(2). 10.3390/cli8020029 [DOI] [PMC free article] [PubMed] [Google Scholar]
- Wilson B (2020). Urban Heat Management and the Legacy of Redlining. Journal of the American Planning Association, 86(4), 443–457. 10.1080/01944363.2020.1759127 [DOI] [Google Scholar]
- World Meteorological Organization. (2023). Past eight years confirmed to be the eight warmest on record.
- Yin Y, He L, Wennberg PO, & Frankenberg C (2023). Unequal exposure to heatwaves in Los Angeles: Impact of uneven green spaces. Science Advances, 9(17), eade8501. [DOI] [PMC free article] [PubMed] [Google Scholar]
- Zachariah M, Philip S, Pinto I, Vahlberg M, Singh R, Otto F, Barnes C, & Kimutai J (2023). Extreme heat in North America, Europe and China in July 2023 made much more likely by climate change. 10.25561/105549 [DOI] [Google Scholar]
- Zelazo PD, Anderson JE, Richler J, Wallner‐Allen K, Beaumont JL, & Weintraub S (2013). II. NIH TOOLBOX COGNITION BATTERY (CB): MEASURING EXECUTIVE FUNCTION AND ATTENTION. Monographs of the Society for Research in Child Development, 78(4), 16–33. 10.1111/mono.12032 [DOI] [PubMed] [Google Scholar]
- Zhang T, Zhou Y, Zhao K, Zhu Z, Chen G, Hu J, & Wang L (2022). A global dataset of daily near-surface air temperature at 1-km resolution (2003–2020). Earth System Science Data Discussions, 2022, 1–18. [Google Scholar]
- Zota AR, & VanNoy BN (2021). Integrating intersectionality into the exposome paradigm: a novel approach to racial inequities in uterine fibroids. American Journal of Public Health, 111(1), 104–109. 10.2105/AJPH.2020.305979 [DOI] [PMC free article] [PubMed] [Google Scholar]
Associated Data
This section collects any data citations, data availability statements, or supplementary materials included in this article.
Supplementary Materials
Data Availability Statement
American Community Survey data are available for public download (https://data.census.gov/). PRISM data can be purchased from the Prism Climate Group at Oregon State University.