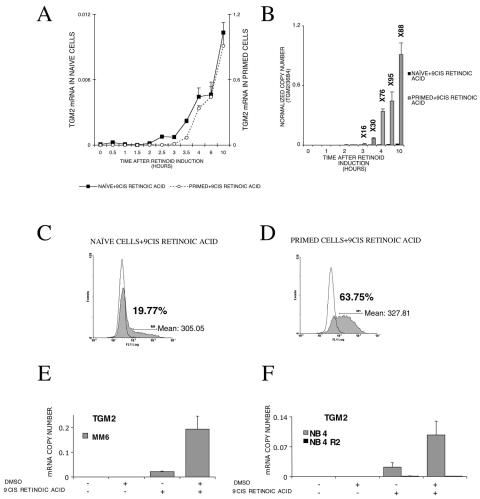
FIG. 2.
TGM2 expression is enhanced by DMSO priming at both the RNA and protein levels, and this effect is not cell type specific. (A) 9-cis retinoic acid induction of TGM2 mRNA as measured by real-time QPCR. The expression of TGM2 mRNA in primed and naive cells is shown on the same graph with two different y axes with a difference of 2 orders of magnitude of the scales. Transcript copy numbers were normalized to 36B4 transcript levels. Values are the means of the results from three independent QPCR measurements ± standard deviations. (B) Relative difference in gene expression in naive and primed cells. Fold changes are indicated above the bars. Copy numbers of TGM2 mRNA are determined by real-time QPCR and normalized to 36B4 transcript levels. Values are the means of the results from three independent QPCR measurements ± standard deviations. (C) Intracellular immunostaining and flow cytometric analysis of retinoid-treated HL-60 cells as described in Materials and Methods. The expression of TGM2 protein in naive cells (shaded) and its isotype control (white) after retinoid induction. The percentage of cells expressing TGM2 protein is shown on the graph along with the mean fluorescence intensity of the positive cells. Values are expressed in arbitrary units (AU). (D) Intracellular immunostaining and flow cytometric analysis of retinoid-treated HL-60 cells as described in Materials and Methods. TGM2 expression in DMSO-primed cells (shaded) along with its isotype control (white). The percentage of cells expressing TGM2 is shown on the graph along with the mean fluorescence intensity of the positive cells, expressed in arbitrary units (AU). At least three independent determinations have been carried out. Data from a representative experiment are shown. (E) Effect of priming upon TGM2 induction by retinoids in MonoMac6 (MM6) cells. TGM2 copy numbers were normalized to cyclophilin transcript levels. Values are the means of the results from three independent QPCR measurements ± standard deviations. (F) TGM2 induction in NB4 and RARα mutant NB4R2 cells in naive and primed states. The mRNA copy numbers were normalized to cyclophilin transcript levels. Values are the means of the results from three parallel QPCR measurements ± standard deviations, and results were confirmed from at least three independent biological samples. +, present; −, absent.

