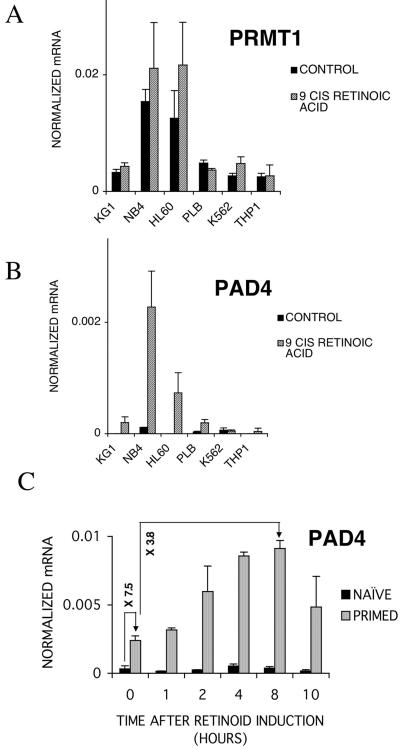
FIG. 7.
Analysis of PRMT1 and PAD4 mRNA levels in different cell lines upon retinoid treatment. (A) PRMT1 mRNA copy numbers were normalized to cyclophilin transcript levels. Values are the means of three independent QPCR measurements ± standard deviations. (B) PAD4 mRNA copy numbers were normalized to cyclophilin transcript levels. Values are the means of three independent QPCR measurements ± standard deviations. (C) mRNA levels of PAD4 in 9-cis retinoic acid-treated naive and DMSO-primed HL-60 cells. Relative increases of mRNA levels during priming or retinoid treatment of primed cells are shown on the arrows. PAD4 mRNA copy numbers were normalized to cyclophilin transcript levels. Values are the means of three independent QPCR measurements ± standard deviations.

