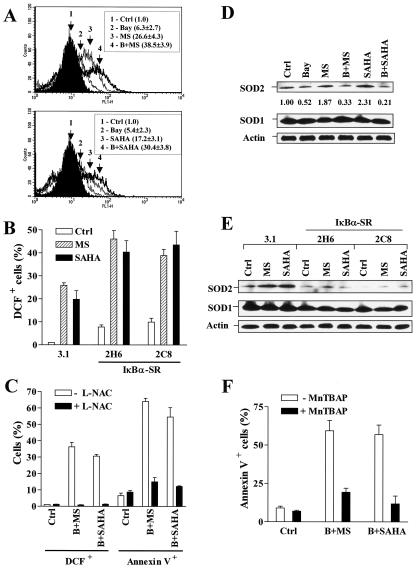
FIG. 6.
Bay 11-7082 and stable transfection with IκBα-SR enhance HDAC inhibitor-mediated ROS generation, accompanied by the downregulation of SOD2. Ctrl, control. (A) U937 cells were exposed for 24 h to 3 μM Bay 11-7082 with (B) or without (Bay) 2 μM MS-275 (MS) (upper panel) or 1 μM SAHA (lower panel), after which the ROS production was determined by a staining with the acetooxymethyl ester of dihydro-dichlorodihydrofluorescein and flow cytometry as described in Materials and Methods. DCF is nonfluorescent in its dihydro form but becomes highly fluorescent upon reaction with ROS. The percentage of cells with increased DCF fluorescence for each condition was determined. (B) Two clones (2H6 and 2C8) of IκBα-SR/U937 cells as well as 3.1/U937 cells were treated for 24 h with 2 μM of either MS-275 (MS) or SAHA, after which the percentage of cells exhibiting positive DCF fluorescence was determined as described for panel A. (C) U937 cells were pretreated with 10 mM L-NAC for 3 h and then exposed to 3 μM Bay 11-7082 (B) plus 2 μM MS-275 (MS) or 1 μM SAHA for additional 24 h, after which the percentages of cells exhibiting positive DCF fluorescence and annexin V-FITC were determined by flow cytometry. (D) U937 cells were treated as described for panel A, after which a Western blot analysis was performed to evaluate levels of SOD1 and SOD2. Density of SOD2 protein bands was quantified by using an imaging system as described in Materials and Methods. Values reflect the ratio of integrated densitometric determinations for each condition relative to untreated controls. Abbreviations are the same as those for panel A. (E) IκBα-SR/U937 cells and 3.1/U937 cells were treated as described for panel B, after which levels of expression of SOD1 and SOD2 were evaluated by Western blot analysis. MS, MS-275. (F) U937 cells were preincubated with 150 μM MnTBAP for 2 h and then treated with 3 μM Bay 11-7082 plus 2 μM MS-275 (B+MS) or 1 μM SAHA (B+SAHA) for additional 24 h. At the end of the incubation interval, cells were harvested and subjected to annexin V/flow cytometric analysis. For panels A through C and F, values represent the means ± SD for three separate experiments performed in triplicate. For Western blot analyses in panels D and E, each lane was loaded with 30 μg of protein; blots were subsequently stripped and reprobed for the expression of β-actin to ensure equivalent loading and transfer of protein. Two additional studies yielded equivalent results.

