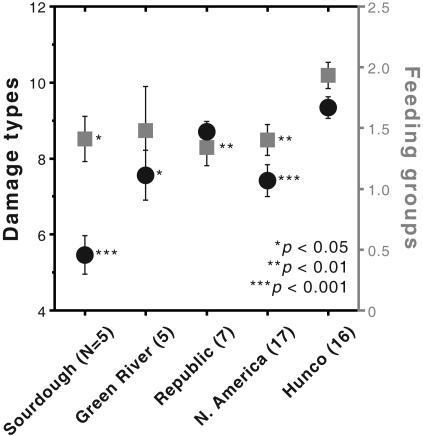
Fig. 4.
Grand means for the resampled species means (shown in Fig. 3) of insect-damage diversity, ±1 standard error of the mean, including single and pooled (second from right) North American samples. n, Number of species in sample. Black circles and left scale, damage types; gray squares and right scale, functional feeding groups. Asterisks next to North American grand means indicate significance (one-way ANOVA) of comparisons with corresponding LH grand means.

