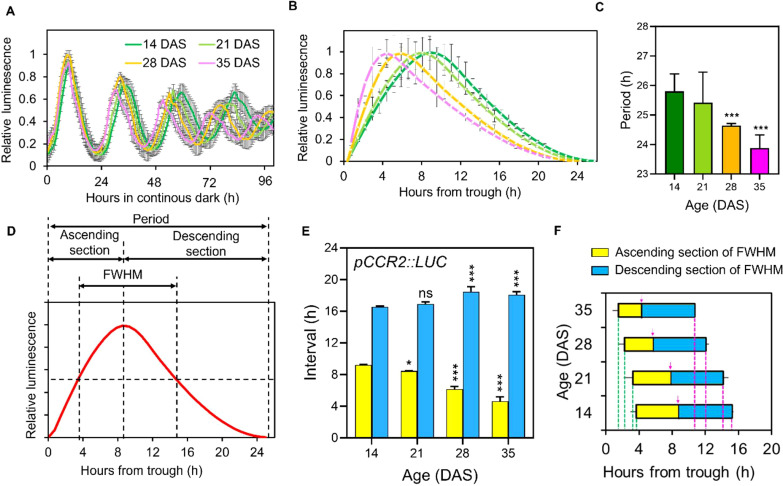
Figure 1.
Age-dependent rhythmic alteration of the free-running circadian rhythm of pCCR2::LUC expression. (A) Total luminescence intensity(relative intensity ± SD) from leaves ofplants expressing pCCR2::LUC in DD at the indicated ages after entrainment to LD cycles (n = 16 leaves for each condition). (B) Normalized and detrended circadian oscillatory curves of the first three cycles of pCCR2:LUC expression (relative intensity ± SD) at each age. (C) Circadian periods (hours ± SD) were measured from the data in (B); *** p-value < 0.001, using one-way ANOVA and Dunnett’s multiple comparison test (n = 12 leaves). (D) Parametrization of the waveform of the circadian oscillation curves. The curves were divided into ascending and descending sections to parameterize the age-dependent changes in the time from trough to crest and from crest to trough, respectively. FWHM value denotes the time elapsed (duration) between the ascending and descending half maximum points. (E) Age-dependent changes of the ascending (yellow bars) and descending sections (blue bars) (hours ± SD); *p-value < 0.05 and ***p-value < 0.001 using two-way ANOVA and Dunnett’s multiple comparison test (n = 3 biological replicates) against the period of 14 DASsamples. (F) Age-dependent changes in FWHM values (hours ± SD). The ascending (yellow bars) and descending parts (blue bars) were divided by the crest timepoints indicated by magenta arrows in each age. Ascending of half maximum is from magenta dashed line to magenta arrow and descending of half maximum is from magenta arrow to green dashed line. ns, not significant.

