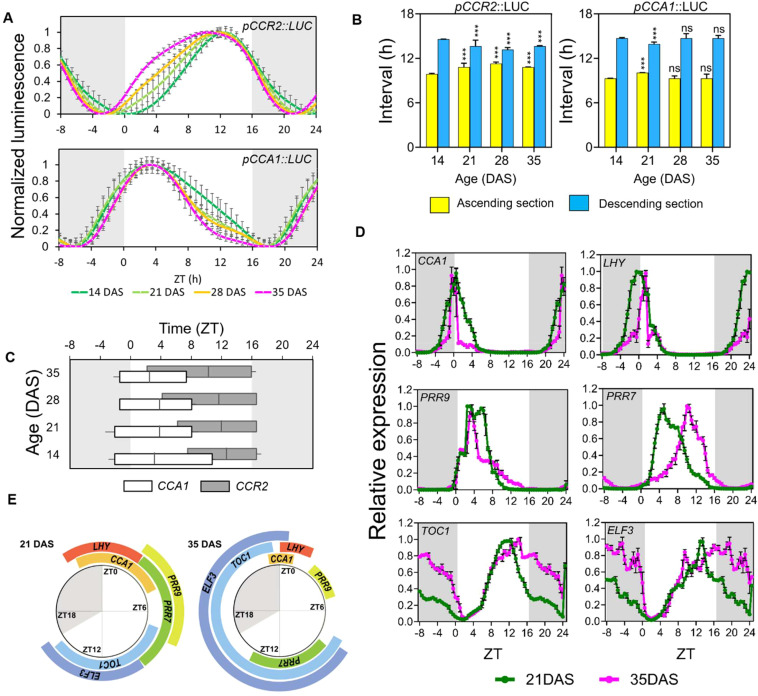
Figure 2.
Age-dependent rhythmic alteration of the daily expression schedule of circadian clock components. (A) Age-dependent changes of promoter activities of pCCR2::LUC and pCCA1::LUC (relative intensity ± SD), respectively, under long-day conditions. Luminescence signals were normalized for amplitude and detrended across the first three cycles to display the differences in period and waveform (n = 16 leaves for each condition). (B) The duration (hours ± SD) of theascending (yellow) and descending (blue) sections; ***p-value<0.001 using two-way ANOVA and Dunnett’s multiple comparison test (n = 16 leaves)against each interval of 14 DAS samples. (C) Age-dependent changes in the FWHM values (hours ± SD). The FWHM values of pCCR2::LUC (upper) and pCCA1::LUC (lower) are shown along with the crest time points. (D) Daily expression patterns of major clock components under long-day conditions. Theexpression (relative expression ± SD) of the circadian clock components at 21 (green) and 35 (magenta) DAS was measured using qRT-PCR with a time resolution of 30 min. The curves are normalized by the average values of amplitudes across time points to better display differences in period and waveform (n = 3biological replicates for each condition). The expression data from ZT 1 to 8 were duplicated and placed in ZT 25-32 for visualization. (E) The dailytimetable of FWHMs of clock components. The FWHMs of each gene in (D) were plotted around a daily schedule to show the changes in durationand timing of FWHM between 21 (left) and 35 (right) DAS plants. (A–D) Data are represented as mean ± SD. ns, not significant. See also Supplementary Figure 2 and Supplementary Figure 3 .

