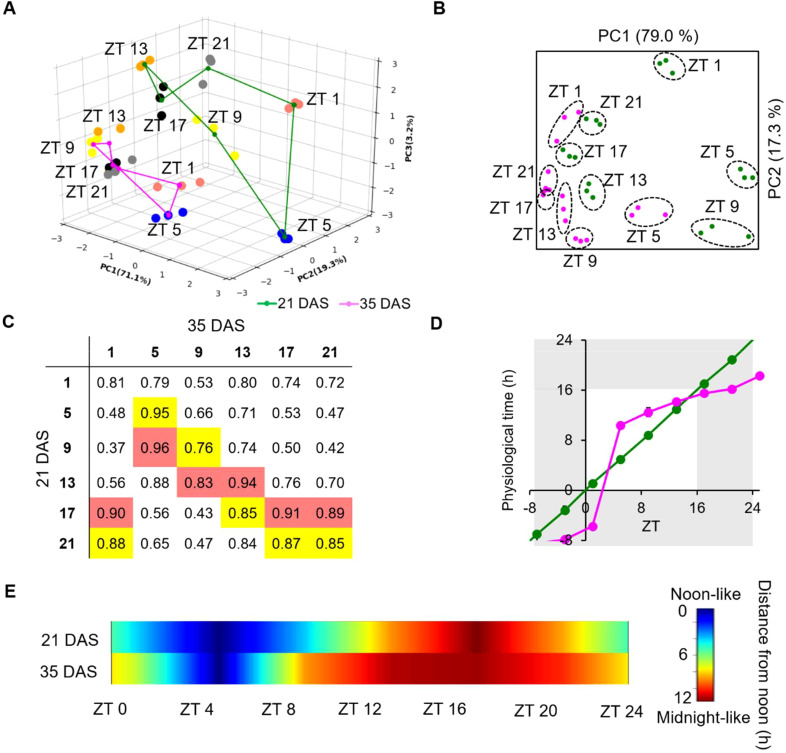
Figure 3.
Transcriptome-level rhythmic alteration of the diurnal expression schedule of genes with a single common oscillation in old plants. (A) Threedimensional PCA of the transcriptomic data from 21 DAS (green lines) and 35 DAS (magenta lines) plants. The transcriptomic data were obtained from the 3rd leaves of 21 and 35 DAS plants collected at 4 h intervals across 24 h; the (n = 3). Dots represent the transcriptomic characteristics of the samples and are colored according to the sampling time: red: ZT1; blue: ZT5; yellow: ZT9; orange: ZT13; black: ZT17; and gray: ZT21. (B) Twodimensional PCA analysis of the transcriptomes following normalization of the amplitude. (C) Correlation matrix of the transcriptome characteristicsof 21 and 35 DAS samples at each time-point. The best and second-best matches between the two transcriptomes are highlighted in red andyellow, respectively. (D) Change of subjective time of the 35 DAS transcriptome relative to the 21 DAS transcriptome. (E) Diagram depicting the change in subjective time across 24 (h) See also Supplementary Figures 6 and 7 .

