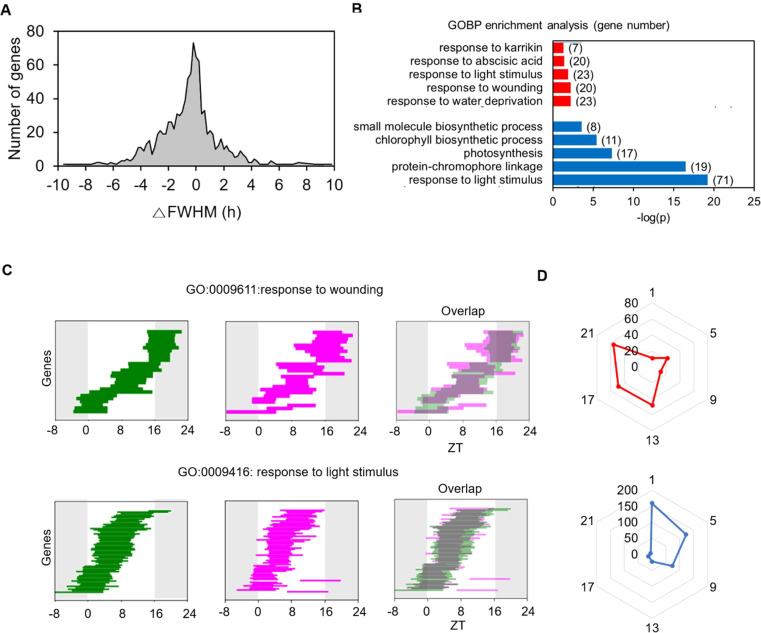
Figure 4.
Age-dependent changes in FWHM of genes with common single daily oscillations at 21 and 35 DAS. (A) Histogram of changes in FWHMs in 35 DASplants compared to those in 21 DAS plants. The FWHM of each gene is the mean value of the cycling curves generated by the permutation of replicates for each time point. (B) Gene Ontology (GO) categories enriched among genes with changed FWHM at 35 DAS. The GO analysis of genes with increased (red) and decreased (blue) FWHM values is shown. (C) Changes in FWHM values of genes involved in the GO categories “response to light stimulus” and “response to wounding”. The FWHM analyses at 21 (green) and 35 (magenta) DAS and their overlap patterns are shown. (D) Polar plots for the number of genes with increased (red) and decreased (blue) FWHM values for genes showing maximum expression at a given time point. See also Supplementary Figures 4 and 5 .

