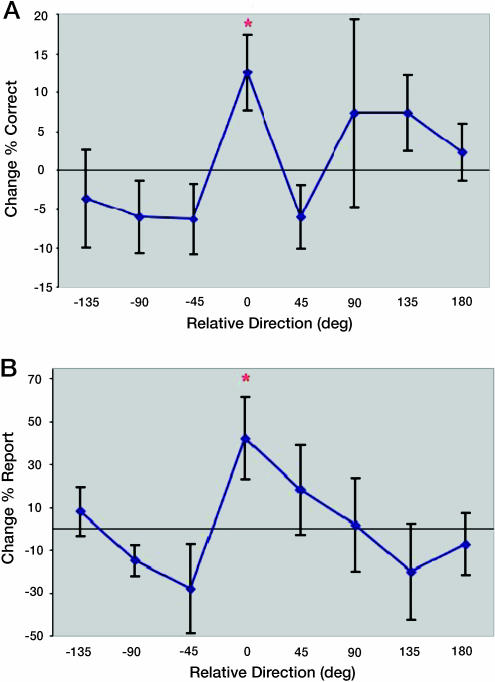
Fig. 2.
Results from the pilot study. (A) Coherence task results. The graph represents the percent of responses for each direction that were correct on the second test minus those from the first test aligned on the paired direction for each subject (0 is the paired direction). (B) Directional bias in contrast task. The graph represents the percent change in the number of reports on the 0-contrast trials for each direction between the first and second tests aligned on the paired direction for each subject (0 is the paired direction). Error bars represent standard errors.

