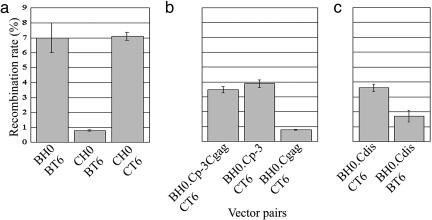
Fig. 2.
Comparison of HIV-1 recombination rates using vectors derived from subtypes B or C and vectors with chimeric packaging signals. (a) Intrasubtype and intersubtype HIV-1 recombination rates. The intrasubtype B recombination rate was published in ref. 24 and is shown here for comparison. (b) HIV-1 recombination rates in pairs of viruses with sequence identity in different regions of the packaging signal (see Fig. 1). (c) The effects of sequence identity in the DIS region on HIV-1 recombination rates. The y axis represents the percentage of GFP+ events relative to total infection events; means and standard deviations generated from at least three experiments are shown.

