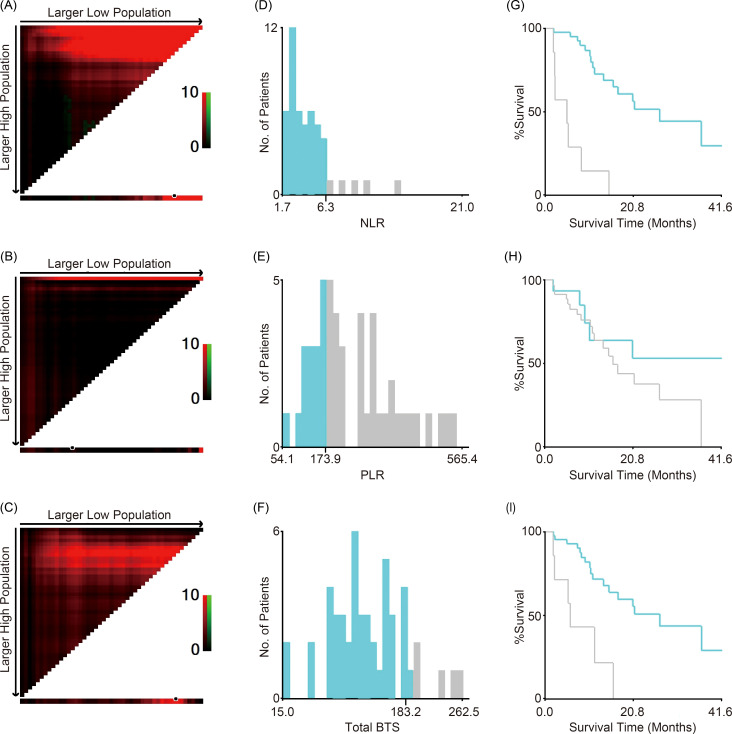
Figure 1.
Cutoff values for NLR, PLR, and total BTS. X-tile software analyses were used to calculate the cutoff values. The optimal cutoff values for NLR, PLR, and total BTS for overall survival are indicated by black/white circles on the X-axes (A–C); these values were 6.3 (D), 173.9 (E), and 183.2 (F), respectively. Kaplan–Meier survival curves for overall survival of patients divided into two groups according to the optimal cutoff values are shown (G–I). BTS, baseline tumor size; NLR, neutrophil-to-lymphocyte ratio; PLR, platelet-to-lymphocyte ratio.

