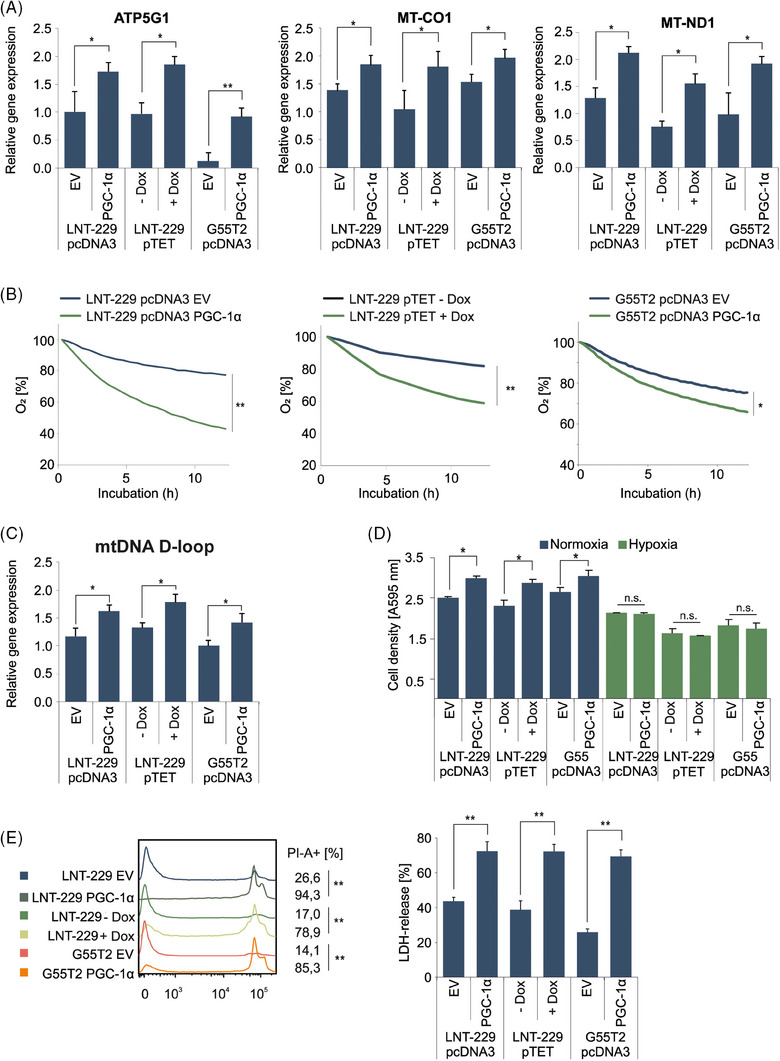
FIGURE 2.

Overexpression of PGC‐1α induces an oxidative phenotype. (A) cDNA of empty vector (EV) and PGC‐1α overexpressing cells cultured in standard conditions was generated. Gene expression of ATP5G1, MT‐CO1 and MT‐ND1 was quantified by qPCR (n = 3, mean ± SD, *p < 0.05, **p < 0.01). (B) Cells were incubated in medium containing 10% FCS with 25 mM glucose. Oxygen consumption was measured by a fluorescence‐based assay (n = 3, mean, **p < 0.01). (C) cDNA of control and PGC‐1α overexpressing cells generated in (A) was analysed for expression of mtDNA D‐loop by qPCR (n = 3, mean ± SD, *p < 0.05). (D) Cells were incubated in culture‐medium containing 25 mM glucose and 10% FCS under normoxic conditions and 1% oxygen. Cell density was measured by crystal violet staining after 3 days (n = 3, mean ± SD). (E) Cells were exposed to glucose restricted (2 mM glucose) serum‐free DMEM under normoxic conditions (data not shown) or 0.1% oxygen until cell death (28 h). Cell death was quantified by by propidium iodide staining (left panel) and LDH release (right panel). The percentage of propidium iodide positive cells (PI‐A +) is indicated (n = 3, representative curves are displayed, **p < 0.01) as well as LDH‐release (n = 4, mean ± SD, **p < 0.01).
