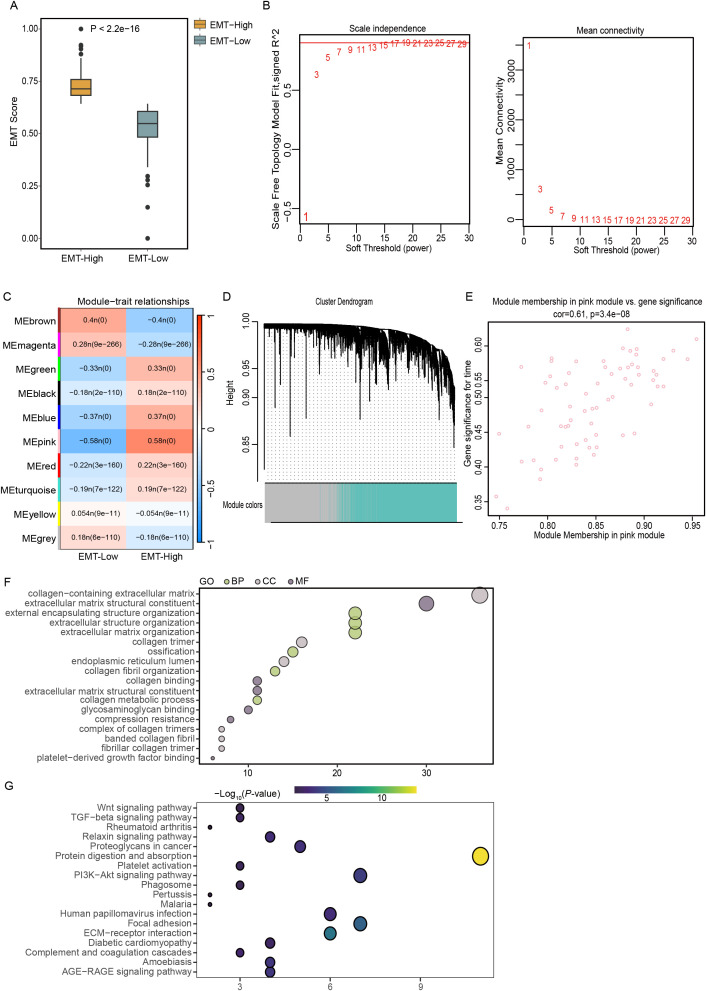
Figure 1.
Elucidating EMT dynamics and key genetic players in THCA using TCGA data. (A) Classification of TCGA-THCA samples into EMT-High and EMT-Low groups using the ssGSEA algorithm. (B) Determination of the optimal soft-thresholding power at 3, illustrated using graphs depicting scale independence and mean connectivity for assessing scale-free network topology. (C) Correlation analysis between gene modules and EMT scores to identify relevant genetic interactions. (D) Construction of a coexpression network using WGCNA based on RNA-seq profiles from the TCGA-THCA dataset. (E) Scatter plot highlighting the pink module, where key genes with a GS greater than 0.5 and MM above 0.7 were identified, indicating significant topological overlap. (F, G) Functional enrichment analyses using GO and KEGG pathway analyses to explore the biological implications of genes within the EMT-based signature.

