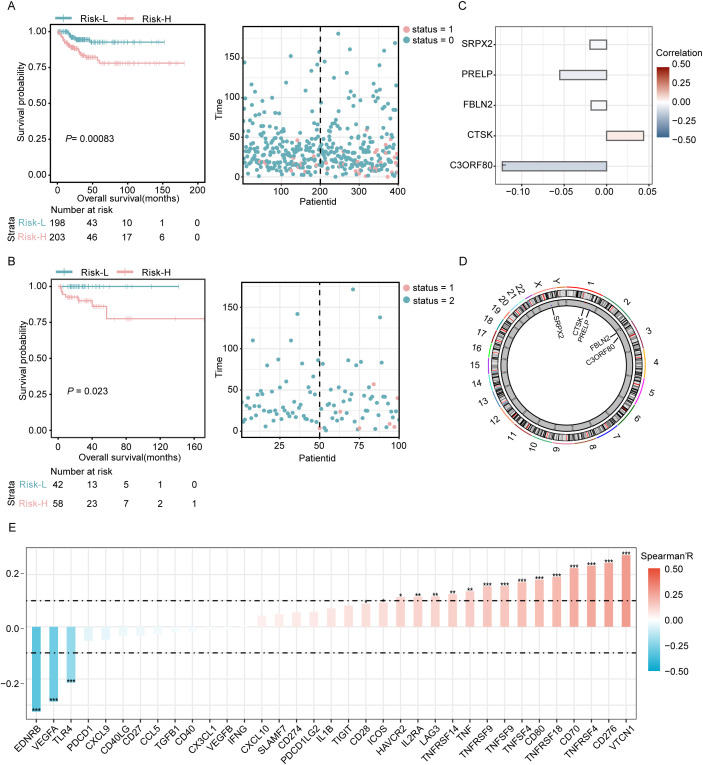
Figure 3.
Prognostic evaluation in training and validation sets with examination of key genes. (A) Visualization of the risk curves showing the distribution of prognostic scores and survival statuses within the training cohort. (B) Risk curves depicting the prognostic scores and survival statuses across the validation cohort. (C) Analysis of the correlation between key genes and patient prognosis. (D) A circular chromosome plot illustrating the genomic positions of key genes relevant to the study. (E) Evaluation of the associations between the risk score model and 43 immune checkpoint genes conducted using Spearman’s correlation coefficient. Significance levels are denoted as *P<0.05, **P<0.01, and ***P<0.001.

