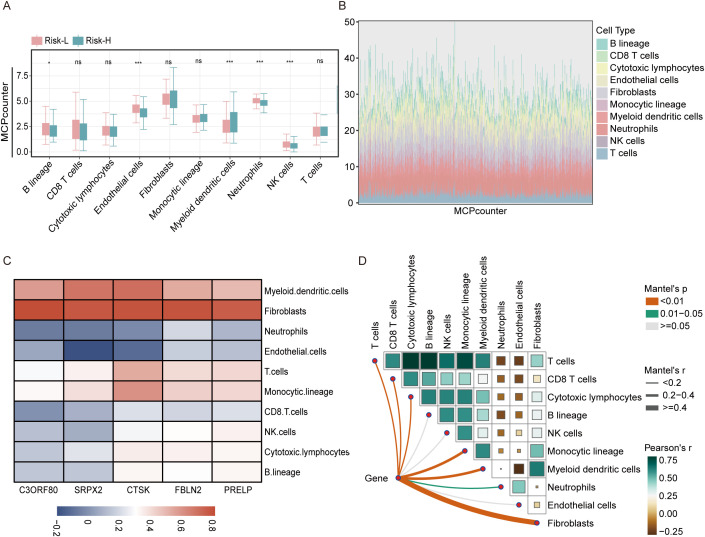
Figure 7.
Analysis of the association between the risk score and immune cell types in the THCA using the MCPcounter approach. (A) A boxplot illustrates the variation in immune cell infiltration among the high-risk and low-risk categories as determined using the MCPcounter algorithm within the TCGA dataset. (B) Stacked bar chart illustrating the distribution of immune cells across 501 thyroid cancer patients as analyzed using MCPcounter. (C) Heatmap displaying the correlations between five key genes and the levels of various immune cell types, as quantified using MCPcounter. (D) LINKET map showing the relationships between the abundances of immune cells linked to ten specific immune cell genes and model genes within the immune microenvironment. ns = non-significant, *P<0.05, ***P<0.001.

