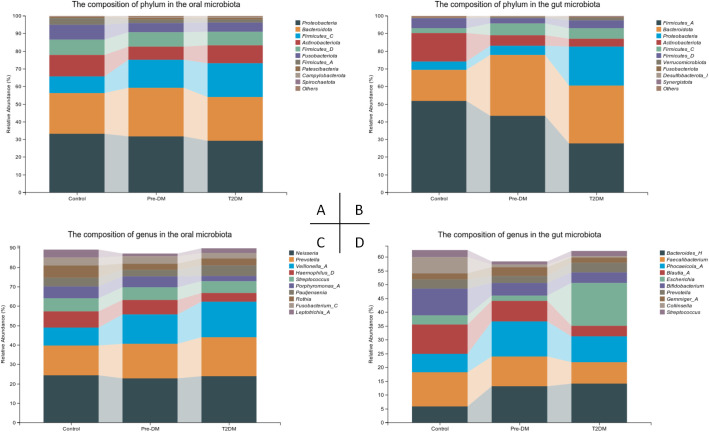
Figure 5.
Compositional alterations of oral and gut microbiota in participants. (A) Stacked bar plots presenting the relative abundance of oral microbiota at the phylum level among participants; (B) Stacked bar plots illustrating the relative abundance of gut microbiota at the phylum level among participants; (C) Stacked bar plots depicting the relative abundance of oral microbiota at the genus level among participants; (D) Stacked bar plots demonstrating the relative abundance of gut microbiota at the genus level among participants.

