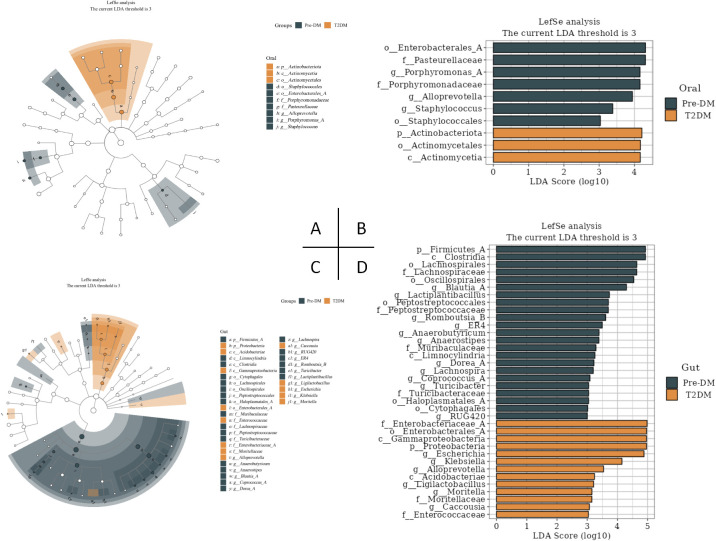
Figure 6.
LEfSe analysis of oral and gut signature microbiota in Pre-DM and T2DM (the LDA threshold was 3). (A) Taxonomic branching map of oral microbiota in Pre-DM group and T2DM group; (B) Bar chart of oral microbiota in Pre-DM group and T2DM group; (C) Taxonomic branching map of gut microbiota in Pre-DM group and T2DM group; (D) Bar chart of gut microbiota in Pre-DM group and T2DM group.

