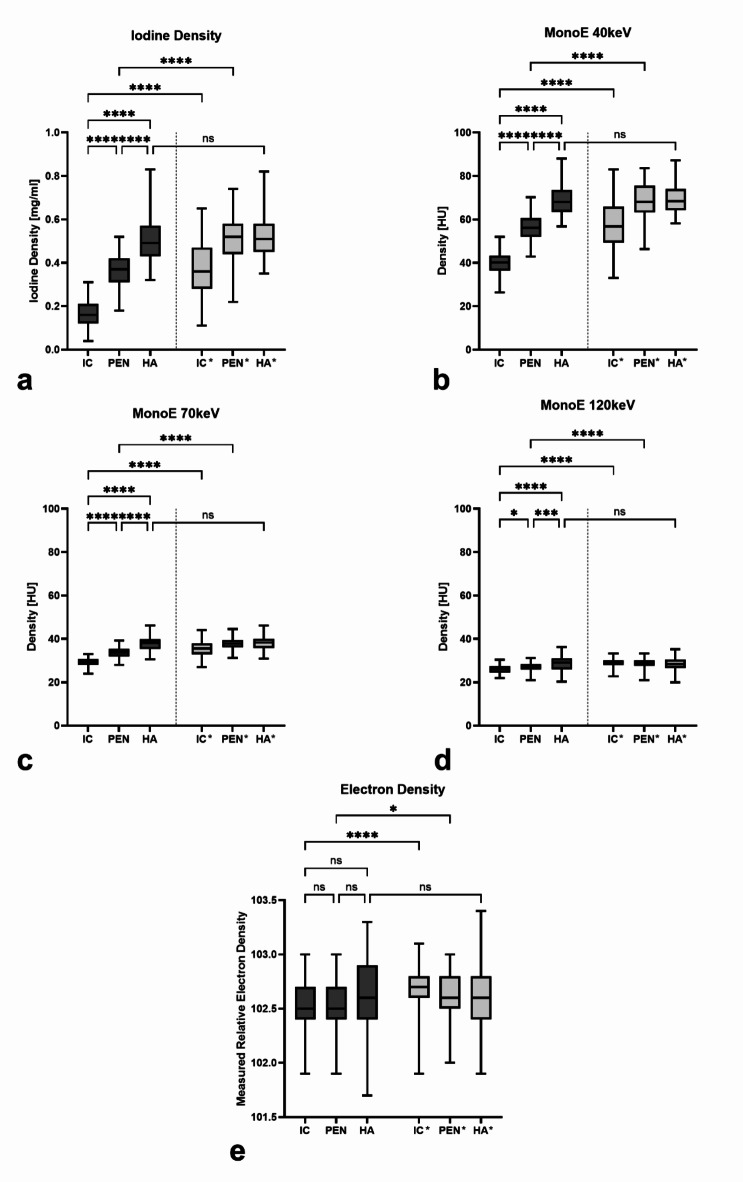
Fig. 3.
Representation of the absolute values measured for the different areas on the infarcted side (IC = infarct core; PEN = penumbra; HA = healthy area) and on the healthy opposite side (IC*, PEN*, HA*) with respect to each spectral parameter. Statistical testing was done to compare IC, PEN and HA between each other as well as to the contralateral regions. Boxes show the median with the range from the 25th percentile to the 75th percentile. Whiskers show the range from minimal to maximal values. (a) iodine density; (b) MonoE 40 keV; (c) MonoE 70 keV; (d) MonoE 120 keV; (e) electron density. ns not significant. *: p < 0.05; **: p < 0.005; ***: p < 0.0005; ****: p < 0.0001.

