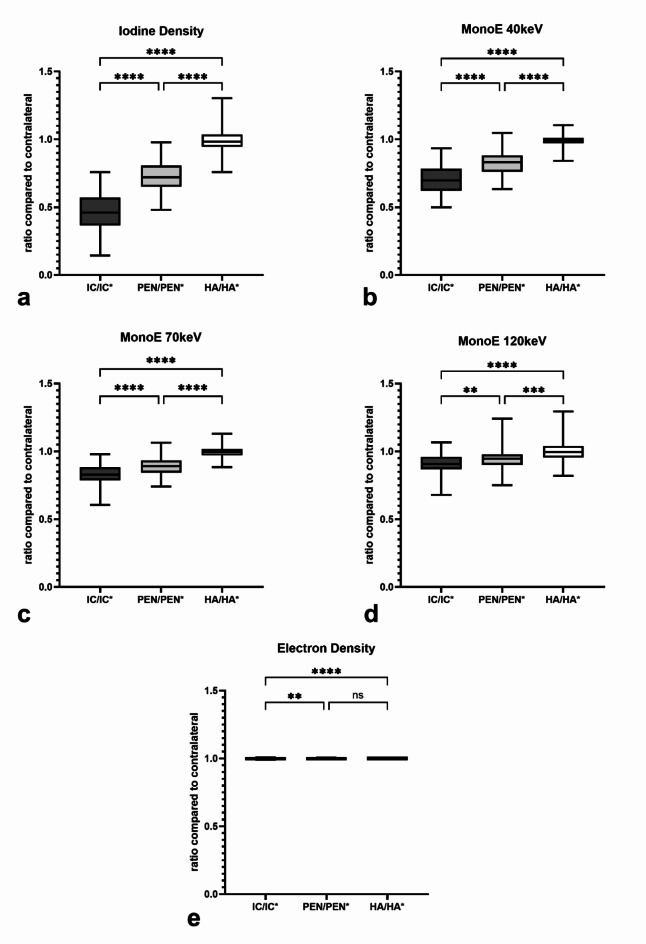
Fig. 5.
(a–e) Ratio of infarct core (IC), penumbra (PEN) and healthy area (HA) versus their healthy counterparts (IC*, PEN* and HA*) with respect to each individual spectral parameter. (a) iodine density; (b) MonoE 40 keV; (c) MonoE 70 keV; (d) MonoE 120 keV; (e) electron density. Statistical testing was done for the comparison between ratios for the infarct core (IC/IC*), the penumbra (PEN/PEN*) and the healthy area (HA/HA*). Boxes show the median with the range from the 25th percentile to the 75th percentile. Whiskers show the range from minimal to maximal values. ns not significant. *: p < 0.05; **: p < 0.005; ***: p < 0.0005; ****: p < 0.0001.

