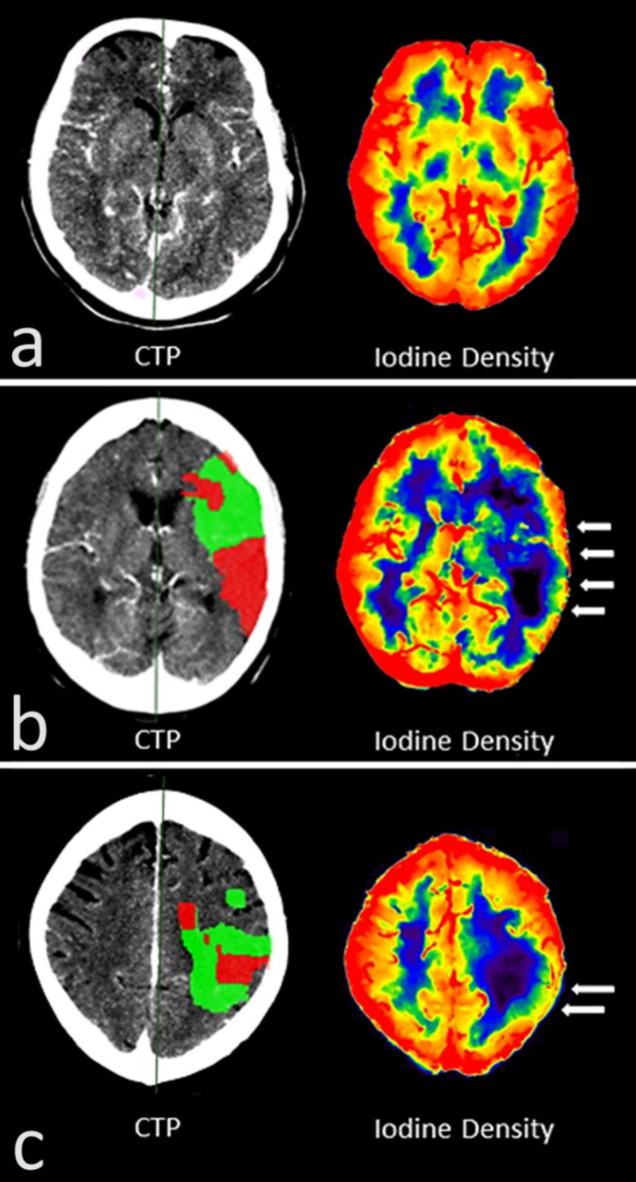
Fig. 8.
(a) Computed tomographic perfusion (CTP) analysis and spectrally derived iodine density (ID) map of a patient without cerebral pathology. The ID shows a homogeneous iodine accumulation in the cortical band that can be delineated peripherally as a correlate of the enhanced perfusion of the gray matter there. In addition, there is a circumscribed enhanced perfusion of the basal ganglia and a relatively lower concentration in the white matter. (b) CTP analysis and spectrally derived ID map of a patient with M1 occlusion on the left. The ID map shows a loss of the cortical iodine rim in the infarct area relative to the contralateral area as a pictorial correlate of the reduced perfusion (white arrows). In addition, there is also weaker perfusion in the affected medullary bed. (c) CTP analysis and spectrally derived ID map of a patient with M2 occlusion on the left. Like (b), the ID map shows a loss of the cortical iodine rim in the infarct area (white arrows) relative to the contralateral area and a weaker perfusion in the infarct-affected medullary bed.

